Email Alert | RSS    帮助

中国防痨杂志 ›› 2023, Vol. 45 ›› Issue (5): 514-519.doi: 10.19982/j.issn.1000-6621.20220517

• 论著 • 上一篇    下一篇

季节性差分自回归滑动平均模型对肺结核发病情况的预测效果研究

任飞林(), 刘小琦, 金玫华, 孙秀秀   

  1. 浙江省湖州市疾病预防控制中心艾滋病与结核病预防控制科, 湖州 313000
  • 收稿日期:2023-01-09 出版日期:2023-05-10 发布日期:2023-04-25
  • 通信作者: 任飞林 E-mail:feilin329@163.com
  • 基金资助:
    湖州市疾病预防控制中心科技计划项目(KJJH202204)

Study on the predictive effect of seasonal auto regressive integrated moving average model on the incidence of pulmonary tuberculosis

Ren Feilin(), Liu Xiaoqi, Jin Meihua, Sun Xiuxiu   

  1. AIDS and Tuberculosis Prevention and Control Department, Huzhou Disease Prevention and Control Center, Zhejiang Province, Huzhou 313000, China
  • Received:2023-01-09 Online:2023-05-10 Published:2023-04-25
  • Contact: Ren Feilin E-mail:feilin329@163.com
  • Supported by:
    Huzhou Center for Disease Control and Prevention Science and Technology Plan Project(KJJH202204)

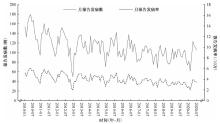
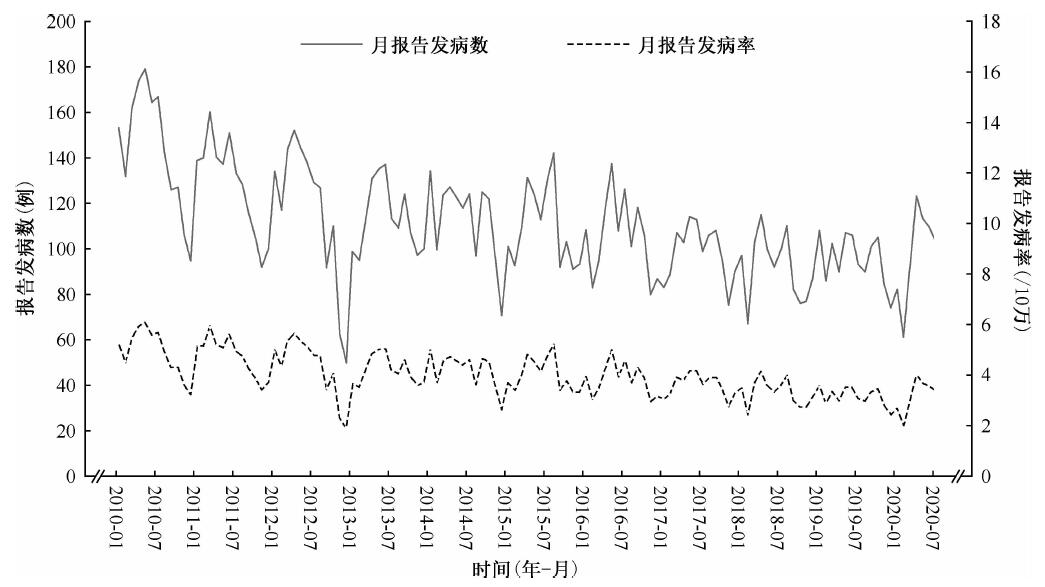
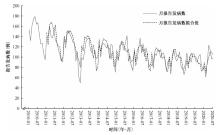
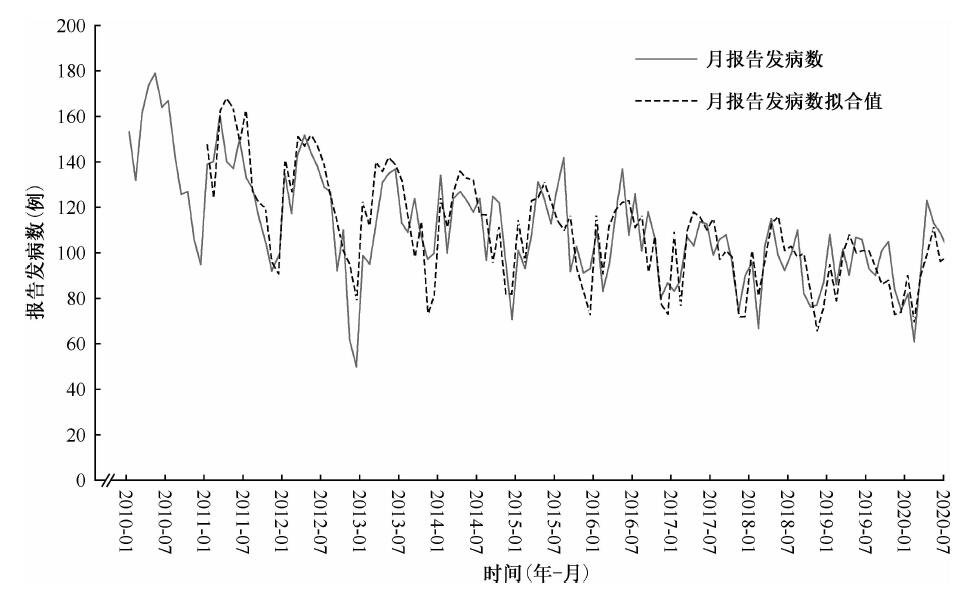
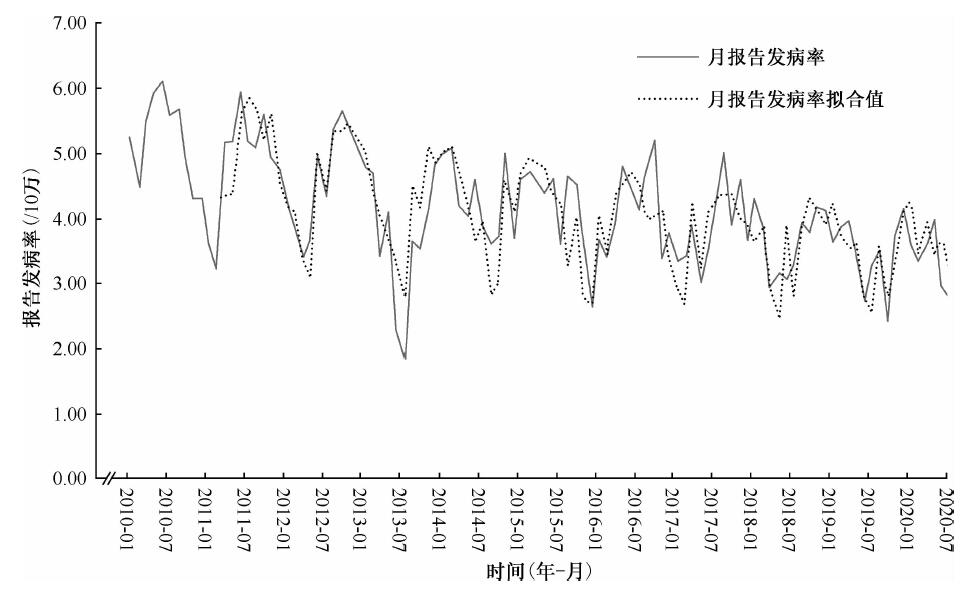
摘要: 目的 分析季节性差分自回归滑动平均(seasonal auto regressive integrated moving average,SARIMA)模型用于肺结核发病情况预测的准确性。 方法 通过“中国疾病预防控制信息系统”子系统“传染病监测系统”收集浙江省湖州市2010年1月至2021年12月肺结核发病数据。利用2010年1月至2020年12月湖州市肺结核月报告数据,分别建立月报告发病数SARIMA模型与发病率SARIMA模型,以2021年1—12月肺结核报告发病数据验证模型,并用平均绝对百分比误差(mean absolute percentage error,MAPE)和均方根误差百分比(relative root mean square error percentage,RMSEP)评价两种模型的预测效果。结果 肺结核月报告发病数SARIMA(0,0,1)(0,1,1)12模型和月报告发病率SARIMA(0,0,1)(1,1,1)12模型为最佳拟合模型。经模型验证,2021年9月湖州市肺结核真实报告发病数(112例)与模型预测发病数相差28.571%,且高于95%CI上限值(109例),其他月报告发病数均在预测值95%CI范围内;2021年湖州市肺结核月报告发病率均在预测值95%CI范围内,其中真实值与预测值最大百分比误差为8.665%。按全年累计发病统计,月报告发病数模型与发病率模型的2021年预测值与真实值百分比误差分别为4.866%和2.483%。月报告发病数模型的MAPE为9.925%、RMSEP为14.167%,月报告发病率模型的MAPE为3.798%、RMSEP为4.463%。从评价效果看,月报告发病率SARIMA模型的MAPERMSEP均小于月报告发病数SARIMA模型。结论 基于2010—2020年湖州市肺结核月报告发病数与发病率建立的SARIMA模型有较好的拟合效果,且月报告发病率模型预测效果优于月报告发病数模型。

关键词: 结核,肺, 预测, 模型,统计学

Abstract:

Objective: To analyze the accuracy of seasonal difference auto regressive moving average (SARIMA) model in predicting the incidence of pulmonary tuberculosis (PTB). Methods: From January 2010 to December 2021, PTB incidence data of Huzhou City, Zhejiang Province collected through “Infectious Disease Reporting System” which was a subsystem of the “Chinese Disease Prevention and Control Information System”. SARIMA models based on monthly incidence rate and case number were established using data from January 2010 to December 2020 while the validation of the model used data from January to December 2021. Prediction effect of the two models were evaluated by two indexes, the mean absolute percentage error (MAPE) and the relative root mean square error percentage (RMSEP). Results: The best model of SARIMA were (0,0,1)(0,1,1)12 for the case number and (0,0,1)(1,1,1)12 for the incidence. The actual reported case number in September 2021 was above the upper limit of 95% confidence interval of the model prediction with a difference of 28.571%. The reported case number of other months were all within the predicted 95% confidence interval (109 cases). All monthly reported incidences were within the predicted 95%CI range. The maximum difference between the predicted incidence and the actual incidence was 8.665%. Counting annual cumulative case number and incidence in 2021, the differences between the predicted value and the true value of the case number model and the incidence model were 4.866% and 2.483%, respectively. MAPE of the case number model was 9.925%, and RMSEP was 14.167%. MAPE of the incidence model was 3.798%, and RMSEP was 4.463%, both were smaller than those of the case number SARIMA model. Conclusion: The SARIMA model based on the monthly reported PTB incidence and case number in Huzhou City from 2010 to 2020 had a good fitting effect. The predictive effect of SARIMA model of the incidence was better than that of the case number model.

Key words: Tuberculosis, pulmonary, Forecasting, Models, statistical

中图分类号: