Email Alert | RSS    帮助

中国防痨杂志 ›› 2020, Vol. 42 ›› Issue (6): 597-603.doi: 10.3969/j.issn.1000-6621.2020.06.011

• 论著 • 上一篇    下一篇

2011—2015年新疆维吾尔自治区涂阳肺结核时空格局分析

尹哲*, 贺湘焱, 李奇凤, 刘亚洁, 张燕, 李德洋, 加依娜·拉兹别克, 古丽娜扎尔·艾克拜尔, 曹明芹()   

  1. 830000 乌鲁木齐,新疆医科大学公共卫生学院(尹哲、刘亚洁、张燕、李德洋、加依娜·拉兹别克、古丽娜扎尔·艾克拜尔、曹明芹);新疆维吾尔自治区人民医院科研教育中心(贺湘焱、李奇凤)
  • 收稿日期:2020-01-02 出版日期:2020-06-10 发布日期:2020-06-11
  • 通信作者: 曹明芹 E-mail:cmq66@126.com
  • 基金资助:
    新疆维吾尔自治区自然科学基金(2018D-01C-127)

Spatial-temporal analysis of smear-positive pulmonary tuberculosis in Xinjiang Uygur Autonomous Region from 2011 to 2015

YIN Zhe*, HE Xiang-yan, LI Qi-feng, LIU Ya-jie, ZHANG Yan, LI De-yang, Jiayina· Lazibieke, Gulinazhaer· Aikebaier, CAO Ming-qin()   

  1. *Public Health Department of Medical School, Xinjiang Medical University, Urumqi 830000, China
  • Received:2020-01-02 Online:2020-06-10 Published:2020-06-11
  • Contact: CAO Ming-qin E-mail:cmq66@126.com

摘要:

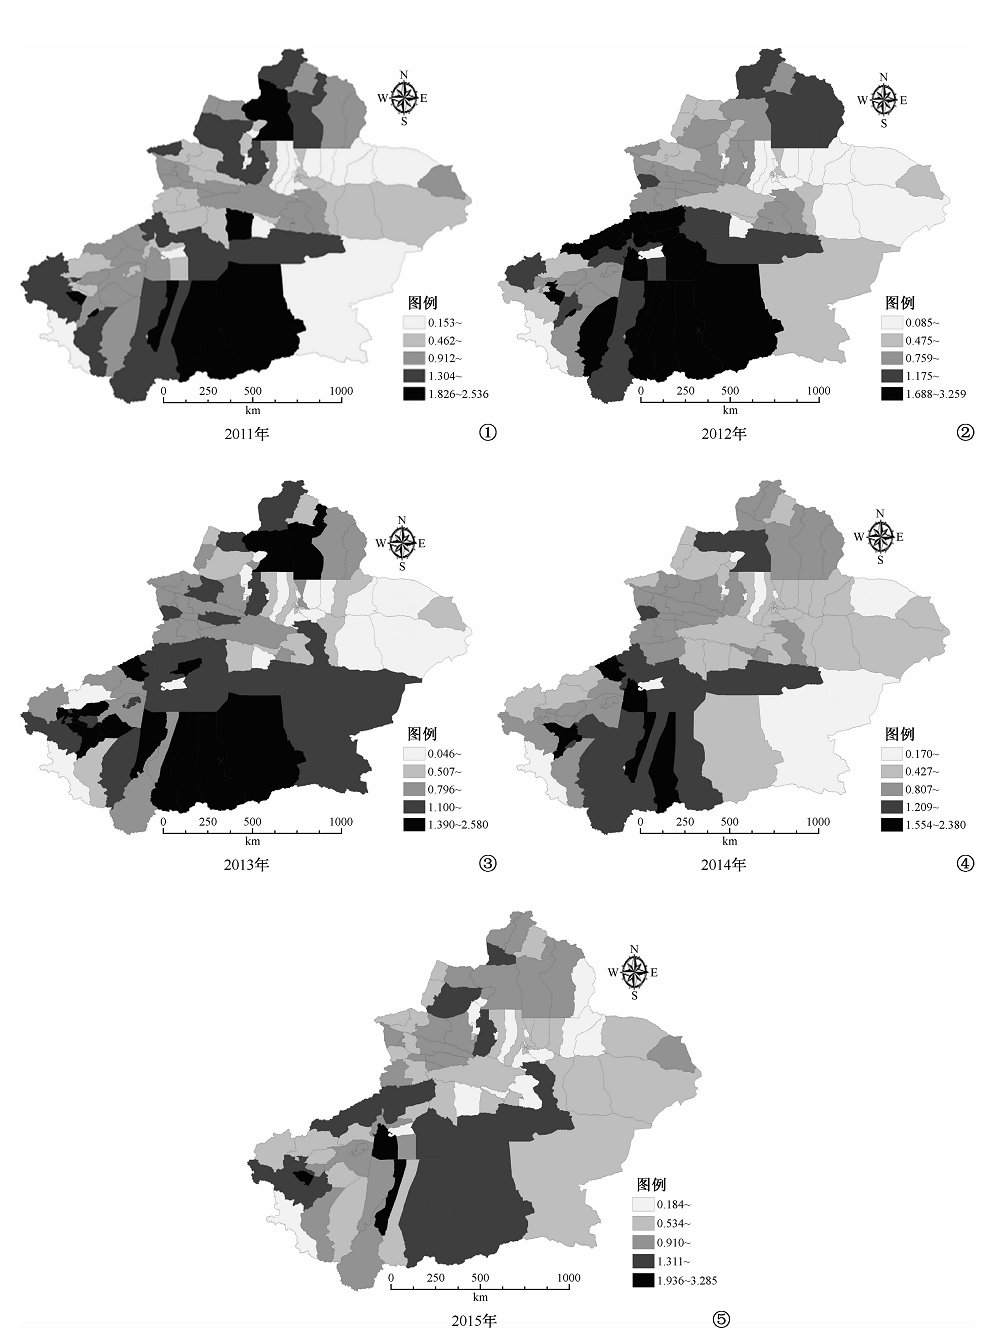
目的 基于新疆维吾尔自治区(简称“新疆”)2011—2015年98个区(县)涂阳肺结核标准化发病比(SMR)数据,采用空间流行病学方法探索性分析肺结核发病风险的时空分布格局。 方法 通过《中国疾病预防控制信息系统》的子系统《传染病报告信息管理系统》获得新疆2011—2015年57 700例涂阳肺结核患者的信息。采用ArcGIS 10.2软件进行地理空间分析,制作结核病SMR分布地图,计算全局Moran I 指数,探究涂阳肺结核SMR空间自相关效应,采用克里金插值法构建估计模型。 结果 新疆涂阳肺结核SMR整体上呈现空间自相关性,2011—2015年莫兰指数(Moran I)值分别为0.261、0.372、0.376、0.248、0.297,Z值分别为10.188、14.424、14.798、9.762、11.594,P值均<0.001);普通克里金模型与经验贝叶斯克里金模型差值估计分布符合实际分布规律,经交叉验证,两模型拟合效果较为理想,经验贝叶斯克里金模型均方根误差(RMSE)范围在0.382~0.484,略高于普通克里金模型(RMSE范围在0.379~0.522)。 结论 2011—2015年新疆涂阳肺结核SMR在区(县)水平上呈现空间聚集性,SMR呈波动性下降趋势。利用克里金插值等空间分析技术可以对新疆活动性肺结核发病风险进行估计。

关键词: 结核, 肺, 空间自相关分析, 流行病学研究特征(主题)

Abstract:

Objective Based on the data of the standardized incidence ratio (SMR) of smear-positive pulmonary tuberculosis (PTB) in 98 districts (counties) in Xinjiang Uygur Autonomous Region (Xinjiang) from 2011 to 2015, the spatial and temporal distribution pattern of PTB risk was explored using spatial epidemiological methods. Methods The information of 57 700 cases of smear-positive PTB in Xinjiang from 2011 to 2015 was obtained through the ‘China Disease Prevention and Control Information System and Infective Diseases Management Information System’. ArcGIS 10.2 software was used for geospatial analysis to create a TB SMR distribution map, the global Moran I index was calculated to explore the spatial autocorrelation effect of smear-positive PTB. The Kriging interpolation method was used to construct the prediction model. Results The SMR of smear-positive PTB in Xinjiang showed spatial autocorrelation. From 2011 to 2015, the values of Moran I were 0.261, 0.372, 0.376, 0.248 and 0.297, respectively, and Z values were 10.188, 14.424, 14.798, 9.762 and 11.594, respectively, with all P values <0.001. The Ordinary Kriging model and the Bayesian Kriging model predicted the distribution in line with the actual distribution law. After cross-validation, the fitting effect of the two models was ideal. The Bayesian Kriging model (RMSE ranged 0.382-0.484) was slightly higher than the Ordinary Kriging model (RMSE ranged 0.379-0.522). Conclusion The SMR of smear-positive PTB in Xinjiang from 2011 to 2015 showed spatial clustering at the district (county) level, and SMR showed a downward trend in volatility. Kriging interpolation analysis is helpful in estimating the risk of active PTB in Xinjiang.

Key words: Tuberculosis, pulmonary, Spatial autocorrelation analysis, Epidemiologic study characteristics as topic