Email Alert | RSS    帮助

中国防痨杂志 ›› 2020, Vol. 42 ›› Issue (6): 590-596.doi: 10.3969/j.issn.1000-6621.2020.06.010

• 论著 • 上一篇    下一篇

2014—2018年广州市学生肺结核发病时空特征分析

赖铿, 雷宇, 杜雨华, 吴桂锋, 谢玮, 沈鸿程, 钟芷晴, 李铁钢()   

  1. 510030 广州市胸科医院结核病控制管理科(赖铿、雷宇、杜雨华、吴桂锋、沈鸿程、钟芷晴),预防保健科(谢玮),院办公室(李铁钢)
  • 收稿日期:2020-02-18 出版日期:2020-06-10 发布日期:2020-06-11
  • 通信作者: 李铁钢 E-mail:tiegang1977@126.com
  • 基金资助:
    “十三五”国家科技重大专项(2018ZX10715004-002-017);广州市高水平临床重点专科和培育专科建设项目(穗卫函[2019]1555号);广东省转化医学创新平台培育建设项目B类(粤卫函[2018]1254号);广州市卫生健康科技重大项目(2020A031003)

Spatial-temporal analysis on tuberculosis among students in Guangzhou City during 2014-2018

LAI Keng, LEI Yu, DU Yu-hua, WU Gui-feng, XIE Wei, SHEN Hong-cheng, ZHONG Zhi-qing, LI Tie-gang()   

  1. Department of TB Control,Management and Department of Preventive Health Care and Hospital Administration Office, Guangzhou Chest Hospital, Guangzhou 510030, China
  • Received:2020-02-18 Online:2020-06-10 Published:2020-06-11
  • Contact: LI Tie-gang E-mail:tiegang1977@126.com

摘要:

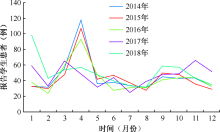
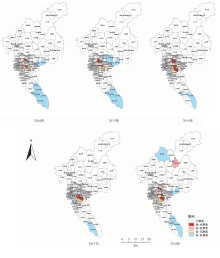
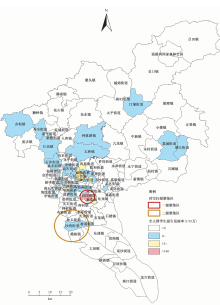
目的 在街道/乡镇水平上分析广州市学生肺结核报告发病的时空分布特征,为学校结核病防控提供参考依据。方法 通过《中国疾病预防控制信息系统》中子系统《传染病报告信息管理系统》下载广州市2014年1月1日至2018年12月31日期间发病的学生肺结核患者传染病报告卡个案信息2755条。在街道/乡镇水平上进行全局及局部空间自相关分析和时空扫描分析,探索其时空分布规律。结果 2014—2018年广州市报告学生肺结核患者的发病率分别为17.14/10万、16.42/10万、15.64/10万、16.57/10万和17.22/10万。发病月份上存在2个发病高峰:2014—2016年分别为3月、4月和9月;2017—2018年分别为1月、12月和9月。全局空间自相关分析发现,在街道/乡镇水平上,2014—2015年广州市全人群中的学生发病无空间聚集性,呈随机分布[莫兰指数(Moran I值)分别为-0.004和0.023,Z值分别为0.098和1.238]。2016—2018年广州市全人群中的报告学生患者的发病整体呈现空间聚集性(Moran I值分别为0.059、0.172、0.088,Z值分别为2.954、6.706、3.565,P值分别为0.012、0.001、0.005)。局部空间自相关分析发现,高-高聚集区主要分布在番禺区:小谷围街道、新造镇;海珠区:琶洲街道、官洲街道;天河区:元岗街道、长兴街道。时空扫描统计结果显示,一级聚集区分布在番禺区(对数似然比为360.04,相对危险度为29.28,P=0.000),覆盖2个街道/乡镇,分别为小谷围街道和新造镇;聚集时间为2016年3月—2018年7月。结论 2016—2018年广州市报告学生肺结核患者在街道/乡镇水平上整体呈现空间聚集性,学生肺结核报告发病的热点主要集中在高校密度高的番禺区小谷围街道片区。

关键词: 结核, 肺, 学生, 发病率, 流行病学研究, 时空聚类分析, 小地区分析, 广州市

Abstract:

Objective To analyze the spatial-temporal characteristics of tuberculosis (TB) affected students at the township level in Guangzhou from 2014 to 2018 and provide evidence for the prevention and control of TB in schools. Methods The information of TB patients who were students was collected by “China Disease Prevention and Control Information System and Infective Diseases Management Information System”. We obtained data of 2755 cases in Guangzhou City with date of onset from January 1, 2014 to December 31, 2018. Global and local spatial auto-correlation analysis and Kulldorff’s Scan Statistics were applied to map the spatial distribution and detect the space-time cluster of those cases during 2014-2018. Result The TB incidence rates among students in Guangzhou City from 2014 to 2018 were 17.14/100000, 16.42/100000, 15.64/100000, 16.57/100000 and 17.22/100000 respectively which presented a trend of decreasing at the beginning and then rising. There were two peaks of monthly incidence during the study period: March to April and September in year 2014 to 2016; December to January and September in year 2017 to 2018. Global spatial auto-correlation analysis found that the incidence among students in Guangzhou from 2014 to 2015 showed a random distribution at the street/township level (Moran I: -0.004 and 0.023, Z: 0.098 and 1.238, respectively). From 2016 to 2018, it showed that there were obvious clustering (Moran I: 0.059, 0.172, 0.088; Z: 2.954, 6.706, 3.565; P: 0.012, 0.001, 0.005). Local indicators of spatial association analysis found 7 high-high clusters as follows: Xiaoguwei and Xinzao in Panyu District, Pazhou and Guanzhou in Haizhu District, Yuangang and Changxing in Tianhe District. Spatiotemporal scan showed that the primary cluster was located in Panyu district, including 2 streets/townships: Xiaoguwei and Xinzao, during March 2016 to July 2018 (log likelihood ratio=360.04, relative risk=29.28, and P=0.000). Conclusion Incidence rates of TB among students displayed spatial clusters at the township level in Guangzhou during 2016 to 2018, with high risk areas relatively concentrated in Xiaoguwei and Yuexiu District with high density of colleges and universities.

Key words: Tuberculosis, pulmonary, Students, Incidence, Epidemiologic studies, Spatial-time clustering, Small-area analysis, Guangzhou