Email Alert | RSS    帮助

中国防痨杂志 ›› 2025, Vol. 47 ›› Issue (10): 1311-1317.doi: 10.19982/j.issn.1000-6621.20250166

• 论著 • 上一篇    下一篇

基于随机森林模型算法预测继发性肺结核的模型构建与验证

褚光炎1, 李婷1, 于嘉宁1, 何迪1, 张堃2, 侯绍英3(), 闫世春4()   

  1. 1黑龙江省传染病防治院,哈尔滨 150500
    2黑龙江省医院临床营养科,哈尔滨 150036
    3哈尔滨医科大学公共卫生学院,哈尔滨 150081
    4黑龙江省疾病预防控制中心,哈尔滨 150030
  • 收稿日期:2025-04-25 出版日期:2025-10-10 发布日期:2025-09-29
  • 通信作者: 侯绍英,Email:hsy3982@163.com;闫世春,Email:yan208@163.com
  • 基金资助:
    黑龙江省卫生健康委科研课题(20230303060013)

Building and evaluating a predictive model for secondary pulmonary tuberculosis based on Random Forest model

Chu Guangyan1, Li Ting1, Yu Jianing1, He Di1, Zhang Kun2, Hou Shaoying3(), Yan Shichun4()   

  1. 1Heilongjiang Provincial Center for Infectious Disease Prevention and Treatment, Harbin 150500, China
    2Department of Clinical Nutrition, Heilongjiang Provincial Hospital, Harbin 150036, China
    3School of Public Health, Harbin Medical University, Harbin 150081, China
    4Heilongjiang Provincial Center for Disease Control and Prevention, Harbin 150030, China
  • Received:2025-04-25 Online:2025-10-10 Published:2025-09-29
  • Contact: Hou Shaoying,Email: hsy3982@163.com;Yan Shichun,Email:yan208@163.com
  • Supported by:
    Scientific Research Project of Heilongjiang Provincial Health Commission(20230303060013)

摘要:

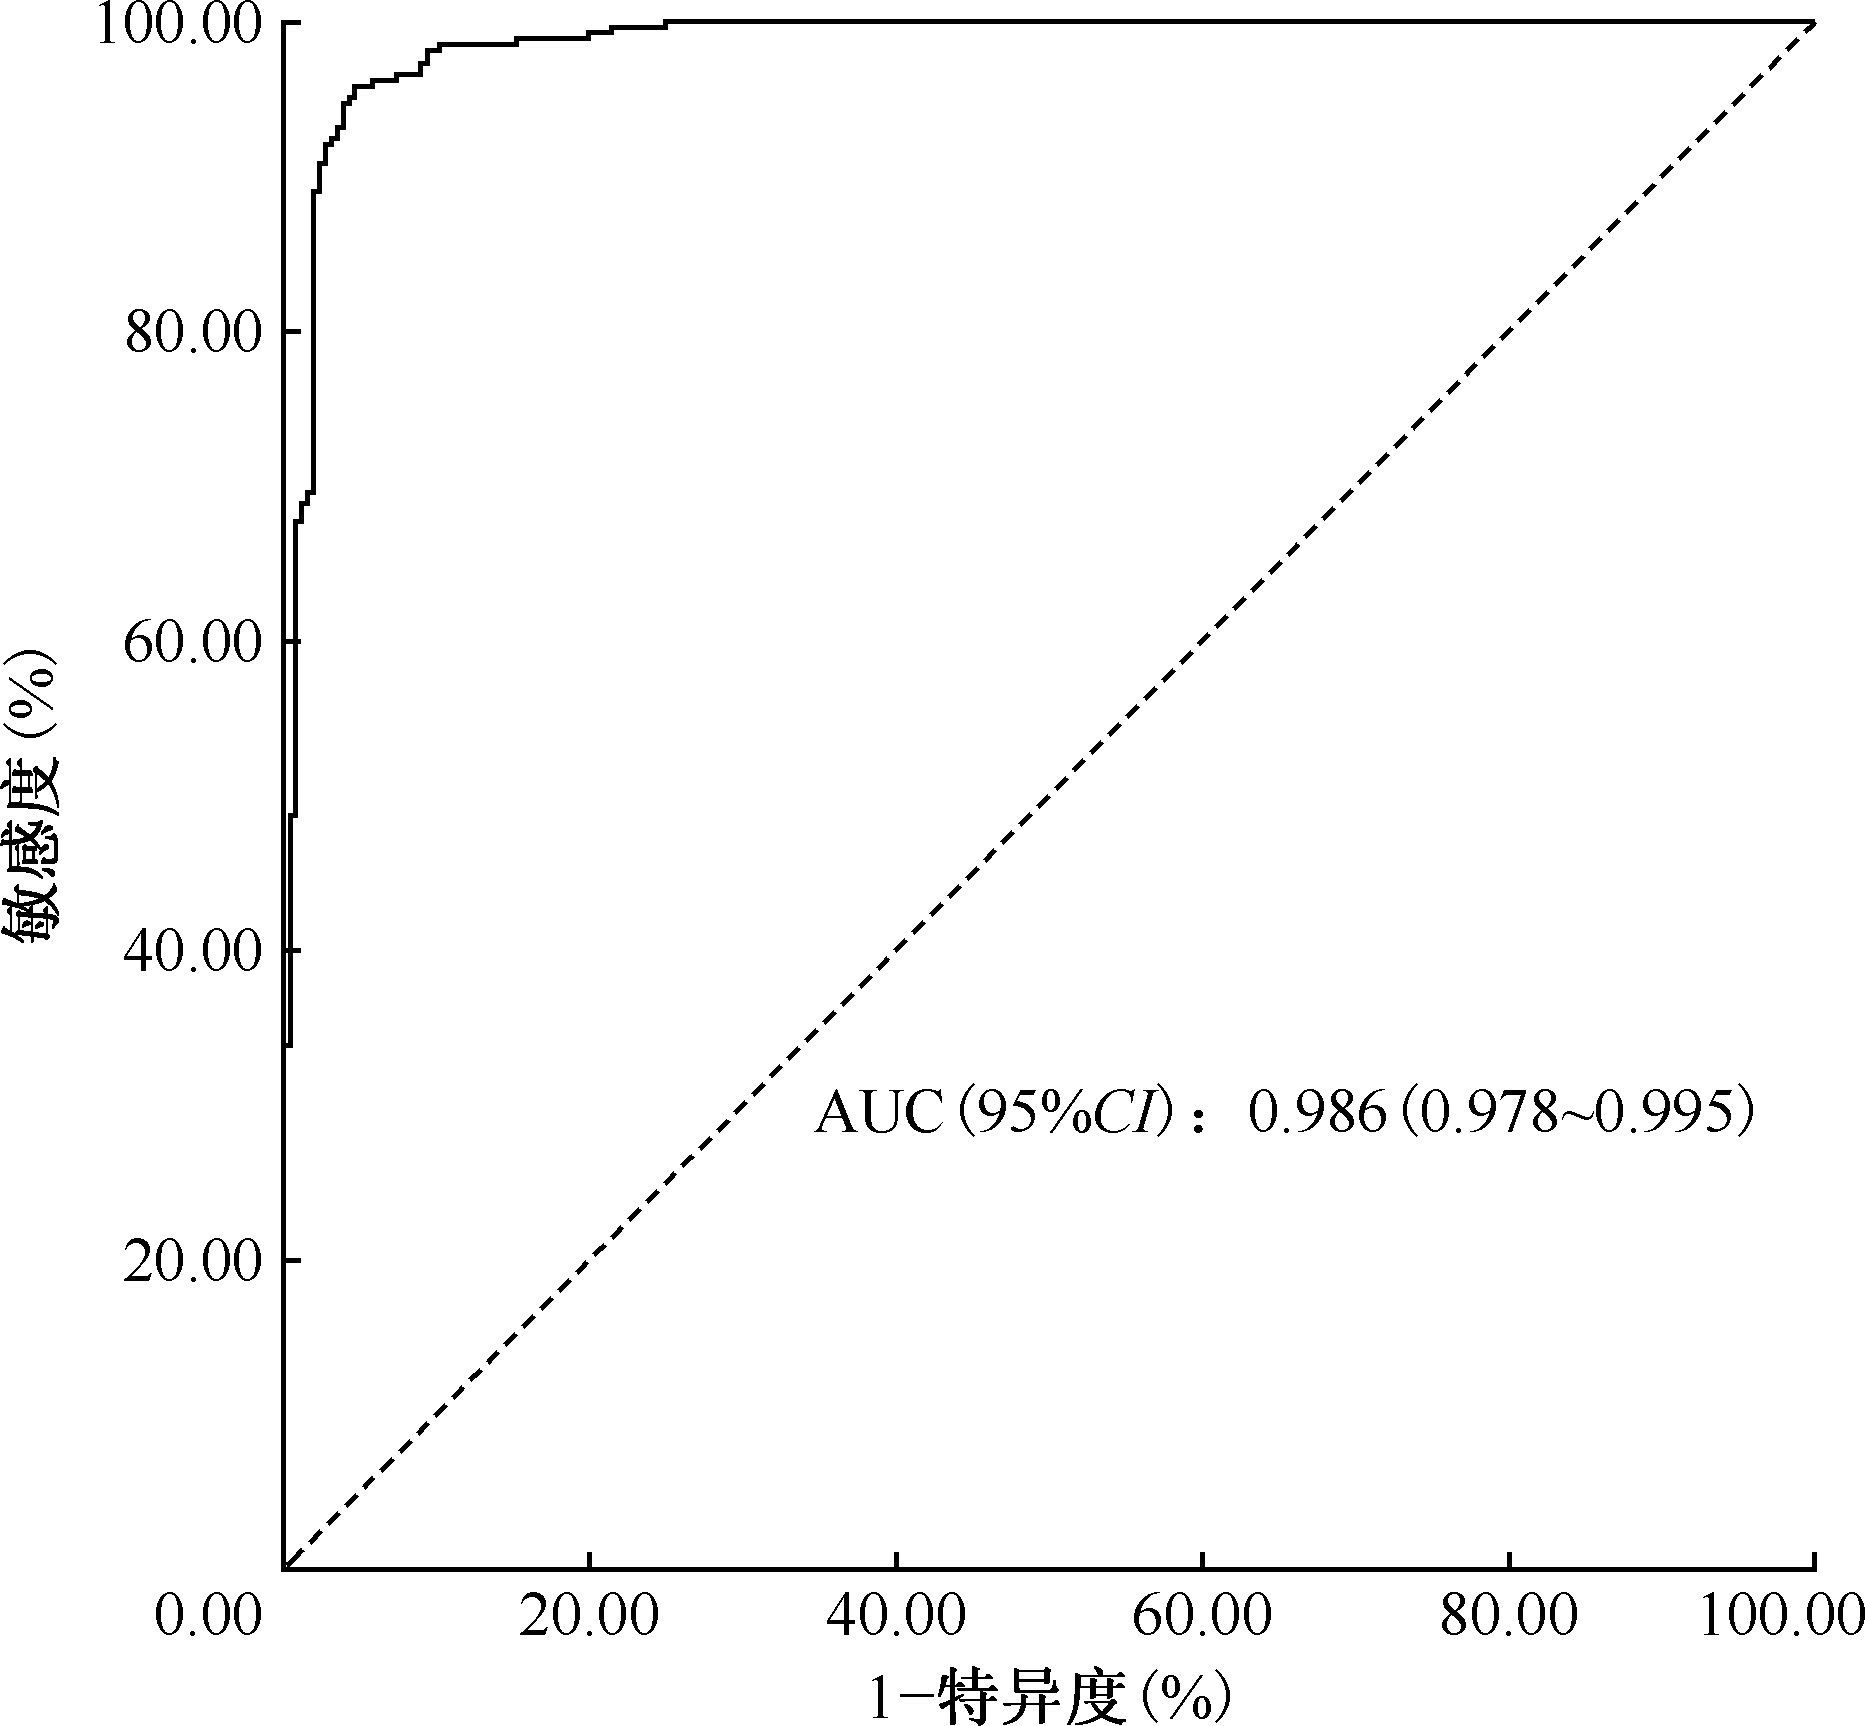
目的: 探讨随机森林模型算法对继发性肺结核的筛查价值,以期为临床早期识别继发性肺结核提供依据。方法: 收集2021年3—9月期间在黑龙江省医院健康管理中心接受体检的健康人群共1208名;以及在黑龙江省传染病院首次确诊并接受治疗的继发性肺结核患者共876例,依据纳入和排除标准,367例继发性肺结核患者纳入观察组,376名体检人群纳入对照组。收集研究对象的基本情况,按照2∶1的比例,将数据分为训练集(495例)和测试集(248例)。模型共纳入38个预测变量,使用训练集数据进行随机森林模型构建,利用测试集数据进行模型验证和评价。对模型中重要性排名前十位的变量进行两组之间的比较分析。结果: 本研究随机森林模型的最优节点数为5,决策树数目为300。模型的准确率为99.60%、精确率为99.92%、敏感度为99.20%、特异度为99.87%,其受试者工作特征(receiver operating characteristic, ROC)曲线下面积(area under curve, AUC)为0.986(95%CI:0.978~0.995)。通过基尼指数(Gini 值)平均降低量筛选出排名前十位的变量,包括血小板分布宽度(30.02)、白球比(20.70)、间接胆红素(19.32)、白蛋白(17.97)、平均血红蛋白浓度(12.24)、尿比重(11.26)、总胆红素(10.09)、总胆汁酸(7.43)、淋巴细胞百分比(6.92)、谷草转氨酶/谷丙转氨酶比值(6.50)。观察组的血小板分布宽度[15.90(15.50,16.20)fl]、谷草转氨酶/谷丙转氨酶比值[1.41(1.02,1.79)]、尿比重分布[正常27例(7.36%)、异常340例(92.64%)]均高于对照组[分别为12.00(11.10,13.30)fl,0.95(0.77,1.15),正常86例(22.87%)、异常290例(77.13%)],差异均有统计学意义(Z=-16.907,P<0.001;Z=-11.951,P<0.001;χ2=34.670,P<0.001)。观察组的白蛋白[(38.42±6.47)g/L]、总胆红素[12.80(9.10,19.00)μmol/L]、间接胆红素[7.60(5.05,11.80)μmol/L]、白球比[1.17(0.97,1.40)]、总胆汁酸[2.80(1.79,5.12)μmol/L]、淋巴细胞百分比[22.90(15.50,32.55)%]、平均血红蛋白浓度[322.00(317.00,328.00)g/L]均低于对照组[分别为(45.14±2.13)g/L,22.25(18.40,26.90)μmol/L,17.40(14.30,19.10)μmol/L,1.60(1.50,1.70),4.60(3.70,5.50)μmol/L,34.60(29.07,39.90)%,336.00(331.00,343.00)g/L],差异均有统计学意义(t=-18.891,P<0.001;Z=-14.313,P<0.001;Z=-16.994,P<0.001;Z=-17.030,P<0.001;Z=-9.675,P<0.001;Z=-12.684,P<0.001;Z=-16.843,P<0.001)。结论: 本研究构建的继发性肺结核患者的随机森林预测模型性能较好,建议进行早期筛查肺结核患者时关注一些营养指标(如间接胆红素、总胆红素、白蛋白等)变化以优化筛查策略,同时在治疗继发性肺结核患者时,注重营养治疗。

关键词: 结核,肺, 预测, 模型, 统计学

Abstract:

Objective: To investigate the screening value of Random Forest model algorithm for secondary pulmonary tuberculosis, aiming to provide a basis for early clinical identification of secondary pulmonary tuberculosis. Methods: A total of 1208 healthy individuals who underwent physical examination at the Health Management Center of Heilongjiang Provincial Hospital from March to September 2021, and 876 patients with secondary pulmonary tuberculosis who were initially diagnosed and received treatment at Heilongjiang Provincial Infectious Disease Hospital were identified. Based on inclusion and exclusion criteria, 367 secondary pulmonary tuberculosis patients were assigned to the observation group and 376 healthy individuals to the control group. Basic demographic data was collected. The dataset was divided into a training set (495 cases) and a testing set (248 cases) with a 2∶1 ratio. The model incorporated 38 predictive variables. A Random Forest model was constructed using the training set data, and its performance was validated and evaluated using the testing set data. A comparative analysis of the top ten important variables identified by the model was performed for the two groups. Results: In this study, the optimal parameters for the Random Forest model were determined to be 5 nodes and 300 trees. The model demonstrated high performance with an accuracy of 99.60%, precision of 99.92%, sensitivity of 99.20%, specificity of 99.87%, and an area under the receiver operating characteristic curve (AUC) of 0.986 (95%CI: 0.978-0.995). The top ten variables ranked by mean decrease in Gini index were identified as: platelet distribution width (30.02), albumin-to-globulin ratio (20.70), indirect bilirubin (19.32), albumin (17.97), mean corpuscular hemoglobin concentration (12.24), urine specific gravity (11.26), total bilirubin (10.09), total bile acids (7.43), lymphocyte percentage (6.92), and aspartate aminotransferase/alanine aminotransferase ratio (6.50).Compared with the control group, the observation group exhibited significantly higher platelet distribution width (15.90 (15.50, 16.20) fl), AST/ALT ratio (1.41 (1.02, 1.79)), and a higher proportion of abnormal urine specific gravity (340 cases (92.64%) vs. normal: 27 cases (7.36%)) versus the control group (12.00 (11.10, 13.30) fl; 0.95 (0.77, 1.15); abnormal: 290 cases (77.13%) vs. normal: 86 cases (22.87%)). These differences were statistically significant (Z=-16.907, P<0.001; Z=-11.951, P<0.001; χ2=34.670, P<0.001, respectively). Conversely, the observation group had significantly lower levels of albumin ((38.42±6.47) g/L), total bilirubin (12.80 (9.10, 19.00) μmol/L), indirect bilirubin (7.60 (5.05, 11.80) μmol/L), albumin-to-globulin ratio (1.17 (0.97, 1.40)), total bile acids (2.80 (1.79, 5.12) μmol/L), lymphocyte percentage (22.90 (15.50, 32.55) %), and mean corpuscular hemoglobin concentration (322.00 (317.00, 328.00) g/L) compared with the control group ((45.14±2.13) g/L; 22.25 (18.40, 26.90) μmol/L; 17.40 (14.30, 19.10) μmol/L; 1.60 (1.50, 1.70); 4.60 (3.70, 5.50) μmol/L; 34.60 (29.07, 39.90) %; 336.00 (331.00, 343.00) g/L). These differences were also statistically significant (t=-18.891, P<0.001; Z=-14.313, P<0.001; Z=-16.994, P<0.001; Z=-17.030, P<0.001; Z=-9.675, P<0.001; Z=-12.684, P<0.001; Z=-16.843, P<0.001, respectively). Conclusion: The Random Forest prediction model constructed in this study for secondary pulmonary tuberculosis patients exhibited excellent performance. It is recommended that early screening for tuberculosis patients should pay attention to changes in certain nutritional indicators (such as indirect bilirubin, total bilirubin, albumin, etc.) to optimize screening strategy. Furthermore, nutritional therapy should be emphasized during the treatment of secondary pulmonary tuberculosis patients.

Key words: Tuberculosis,pulmonary, Forecasting, Models, statistical

中图分类号: