Email Alert | RSS    帮助

中国防痨杂志 ›› 2024, Vol. 46 ›› Issue (3): 294-301.doi: 10.19982/j.issn.1000-6621.20230278

• 论著 • 上一篇    下一篇

CT影像组学结合临床特征预测活动性耐药肺结核的模型构建与验证

潘犇1, 梁长华1(), 韩东明2(), 崔俊伟3, 姚阳阳1, 魏正琦1, 甄思雨1, 危涵羽1, 杨鑫淼1   

  1. 1河南省新乡医学院第一附属医院放射科,新乡 453100
    2河南省新乡医学院第一附属医院磁共振科,新乡 453100
    3河南省新乡医学院第一附属医院结核科,新乡 453100
  • 收稿日期:2023-08-09 出版日期:2024-03-10 发布日期:2024-03-05
  • 通信作者: 梁长华,Email: liangchanghua12345@163.com;韩东明,Email: 625492590@qq.com

Model construction and validation for predicting active drug-resistant pulmonary tuberculosis using combined CT radiomics and clinical features

Pan Ben1, Liang Changhua1(), Han Dongming2(), Cui Junwei3, Yao Yangyang1, Wei Zhengqi1, Zhen Siyu1, Wei Hanyu1, Yang Xinmiao1   

  1. 1Department of Radiology, The First Affiliated Hospital of Xinxiang Medical University, Xinxiang 453100, China
    2Department of MRI, The First Affiliated Hospital of Xinxiang Medical University, Xinxiang 453100, China
    3Department of Tuberculosis, The First Affiliated Hospital of Xinxiang Medical University, Xinxiang 453100, China
  • Received:2023-08-09 Online:2024-03-10 Published:2024-03-05
  • Contact: Liang Changhua, Email: liangchanghua12345@163.com; Han Dongming, Email: 625492590@qq.com

摘要:

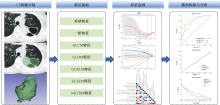
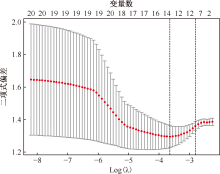
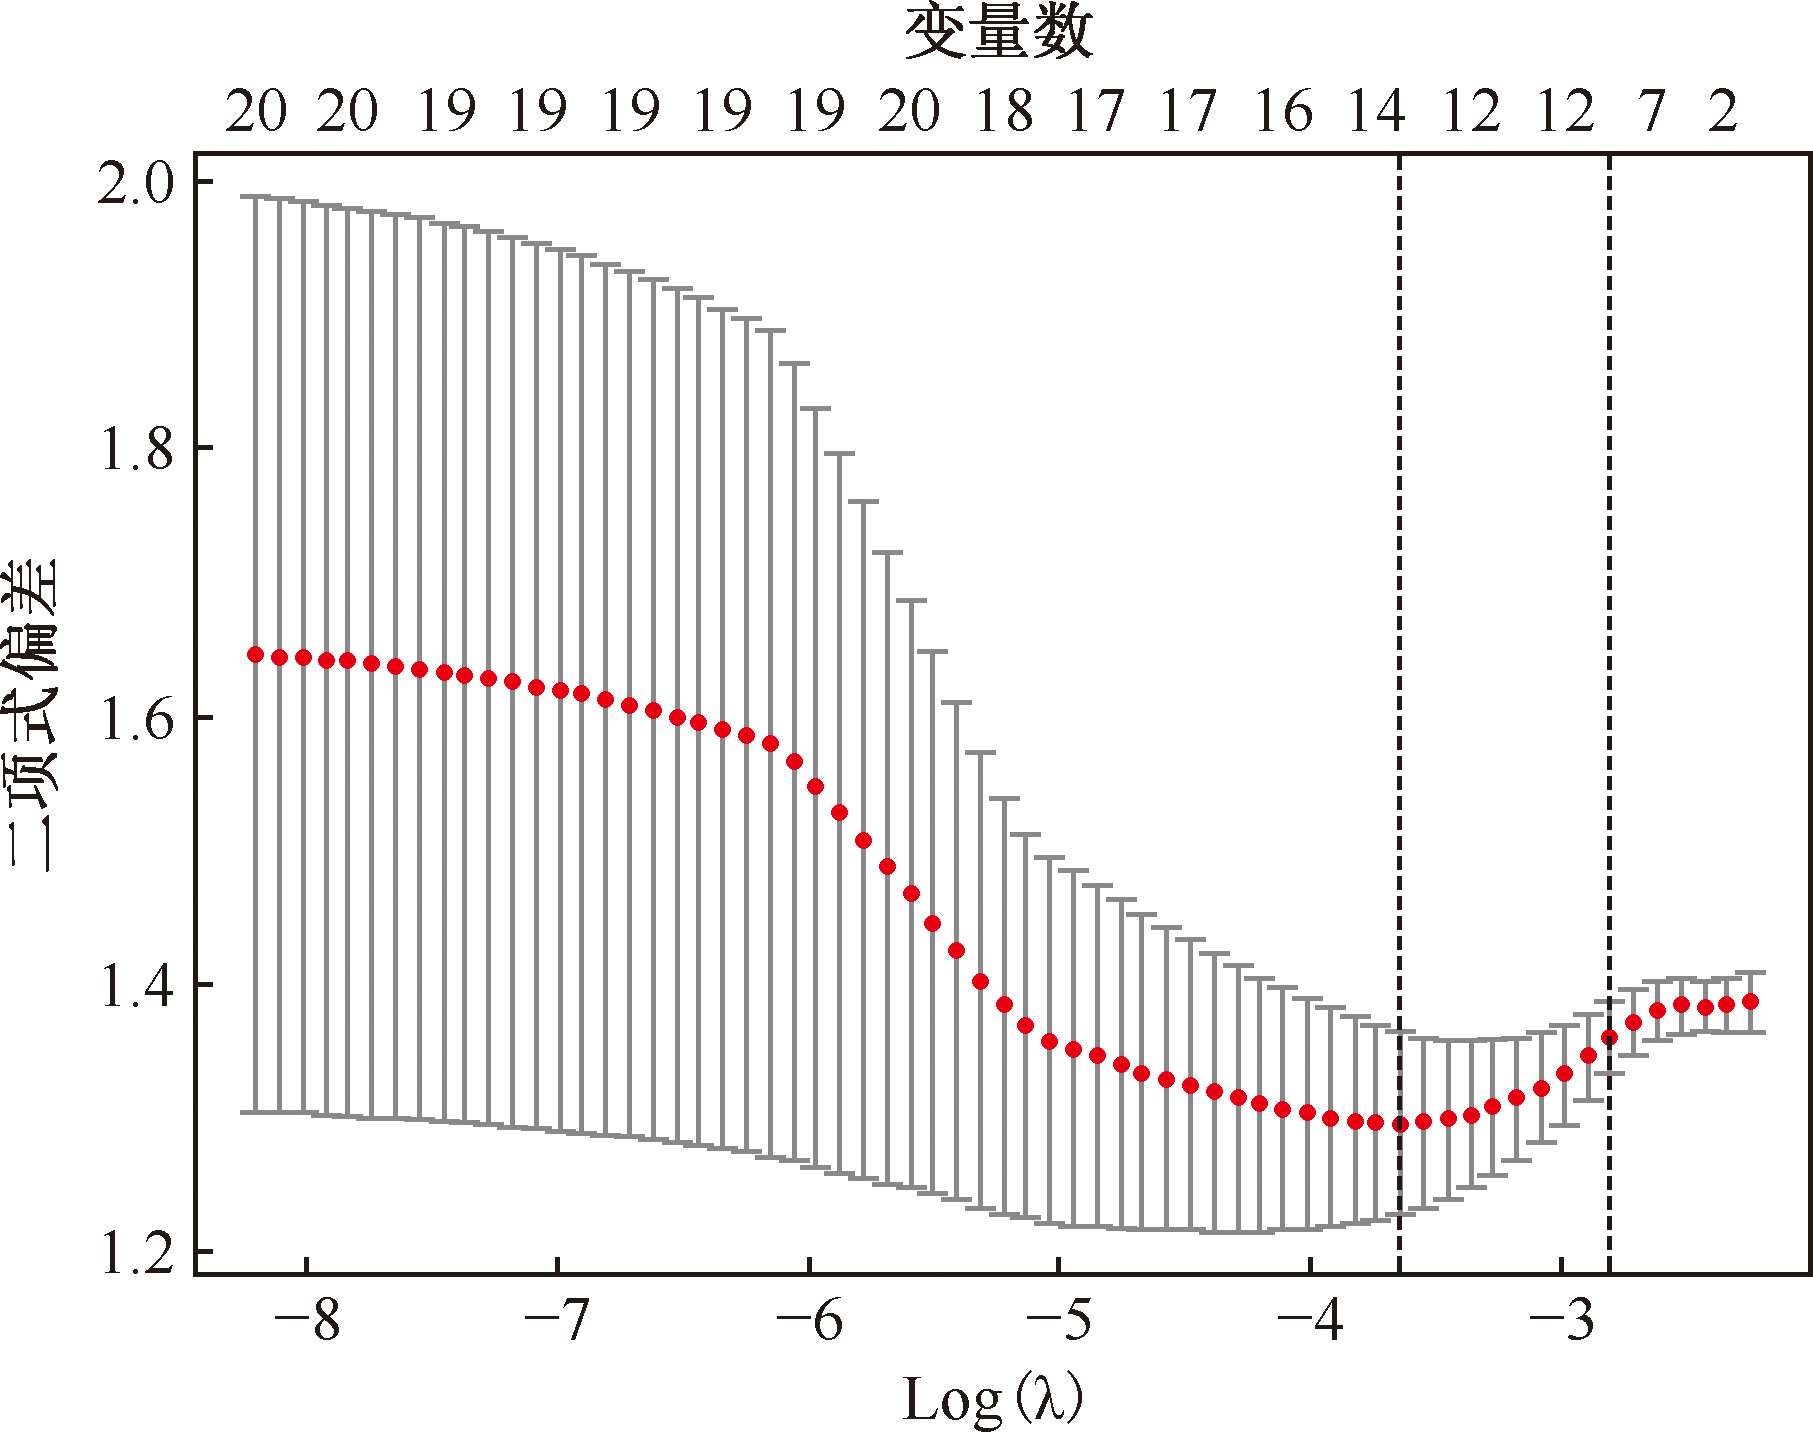
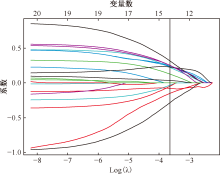
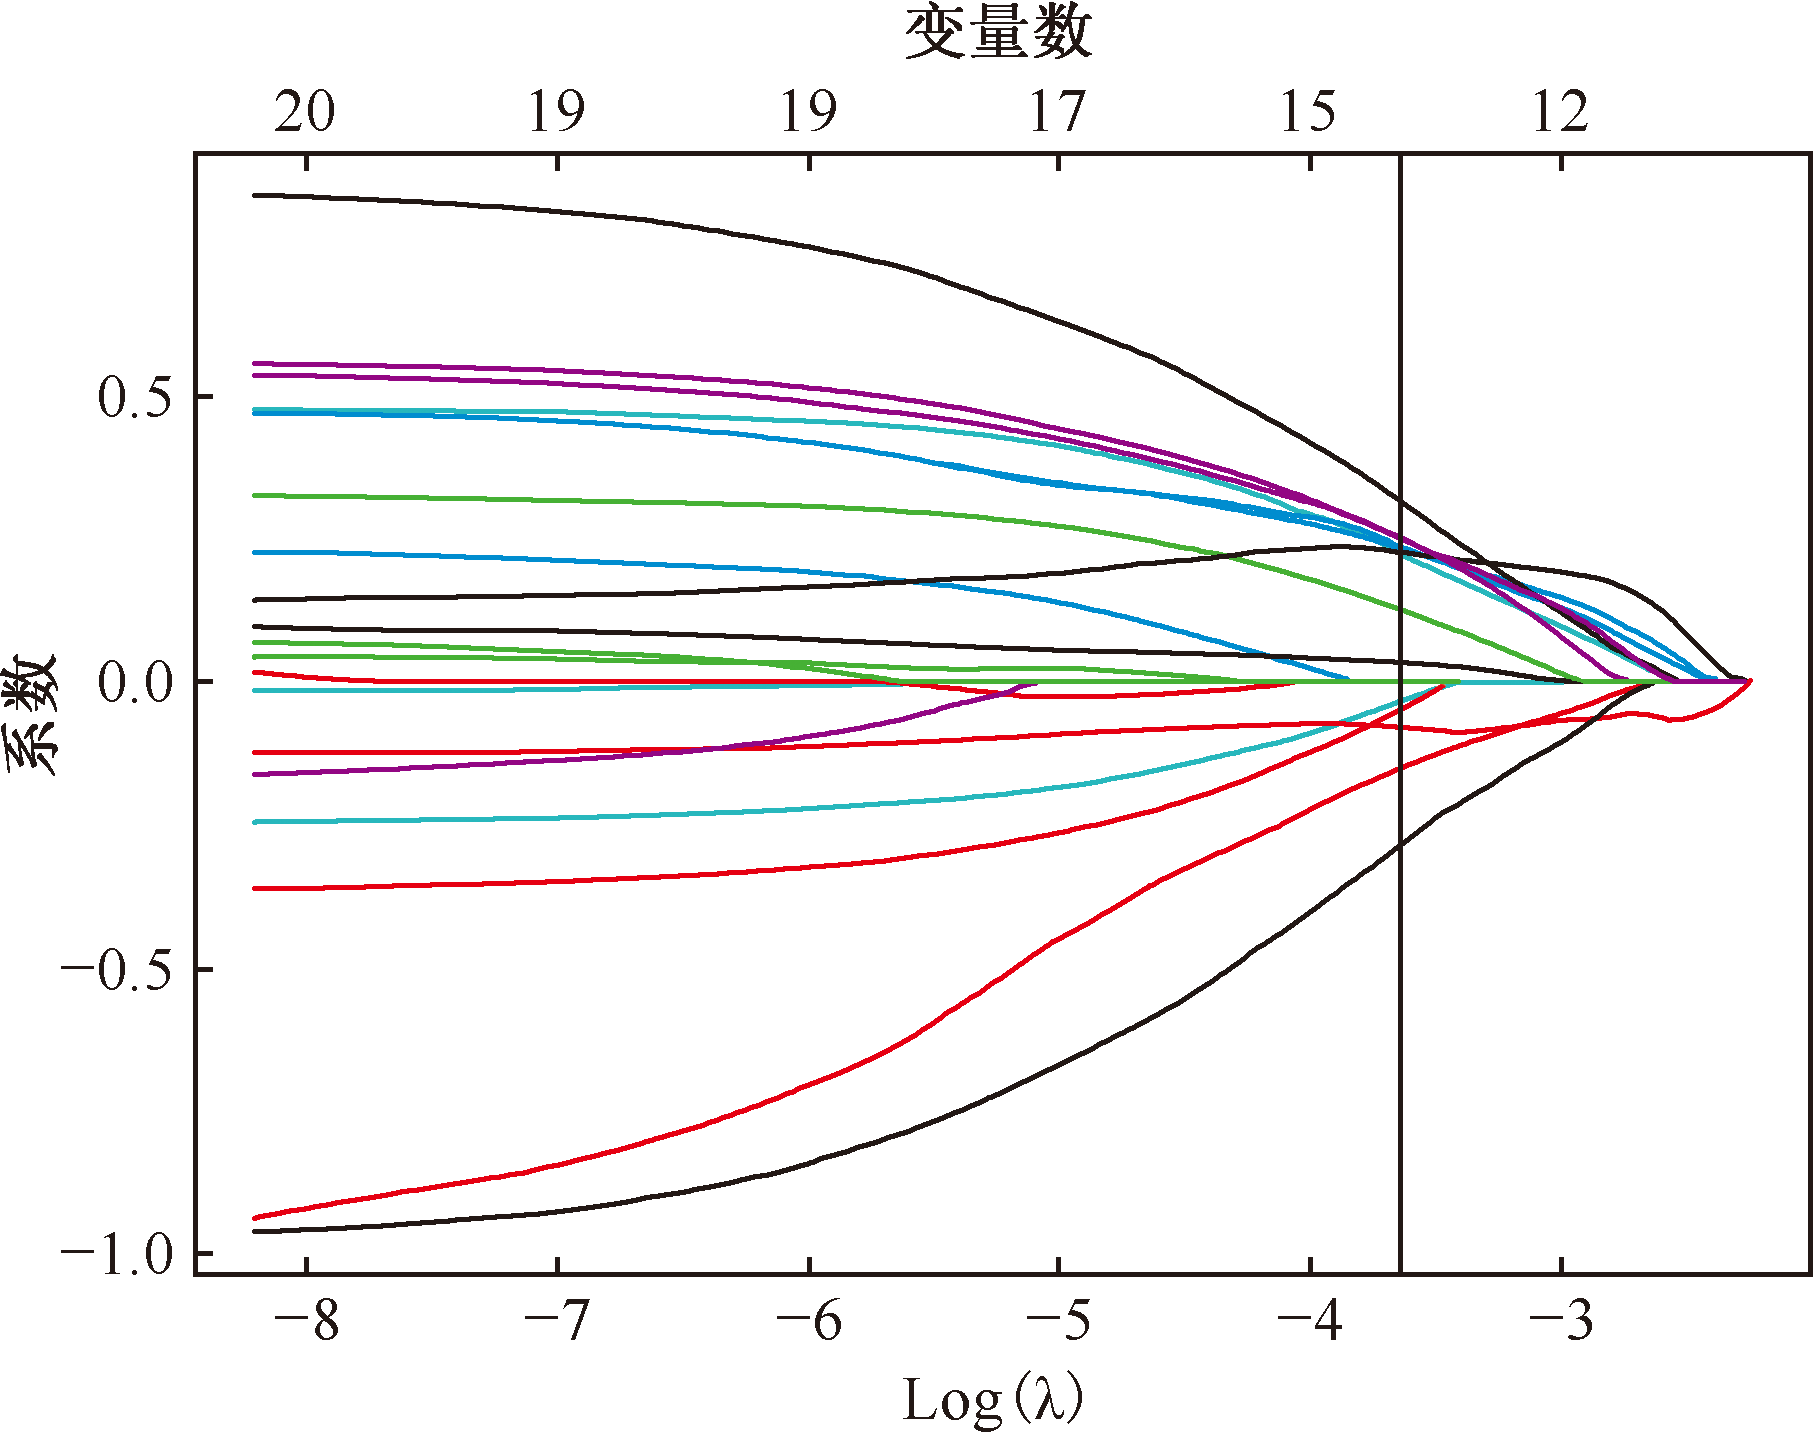
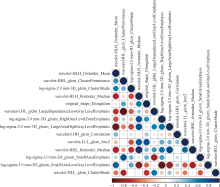
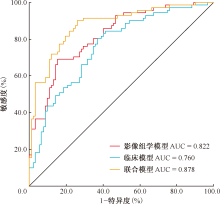
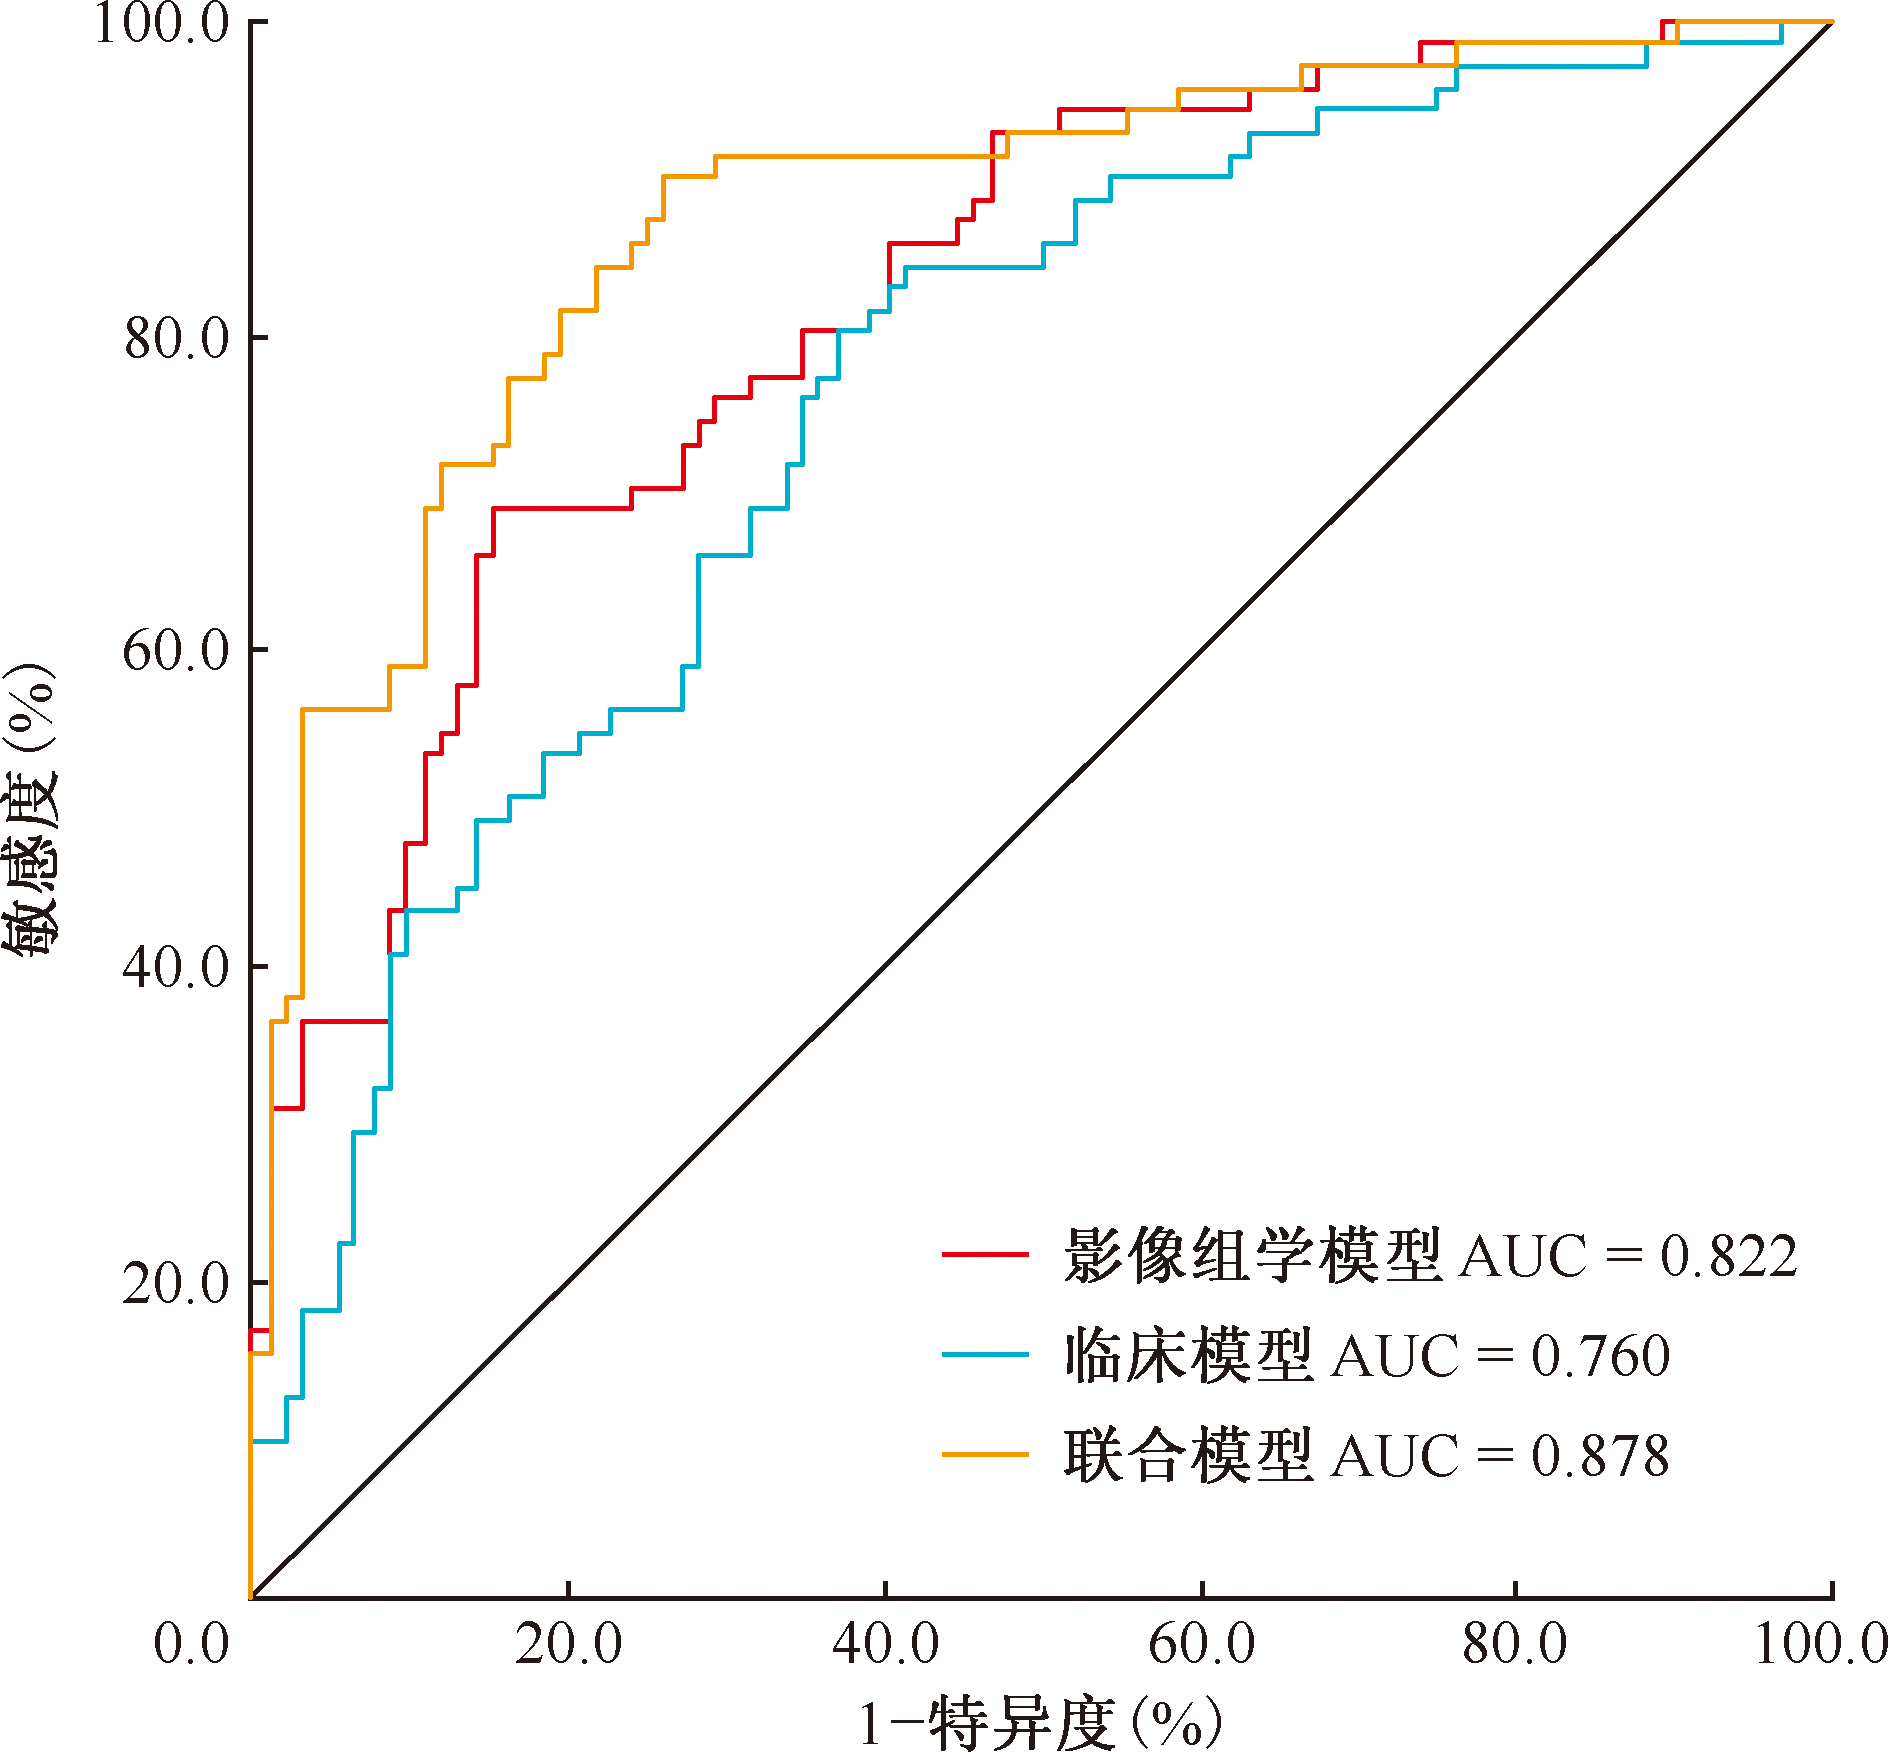
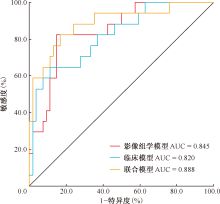
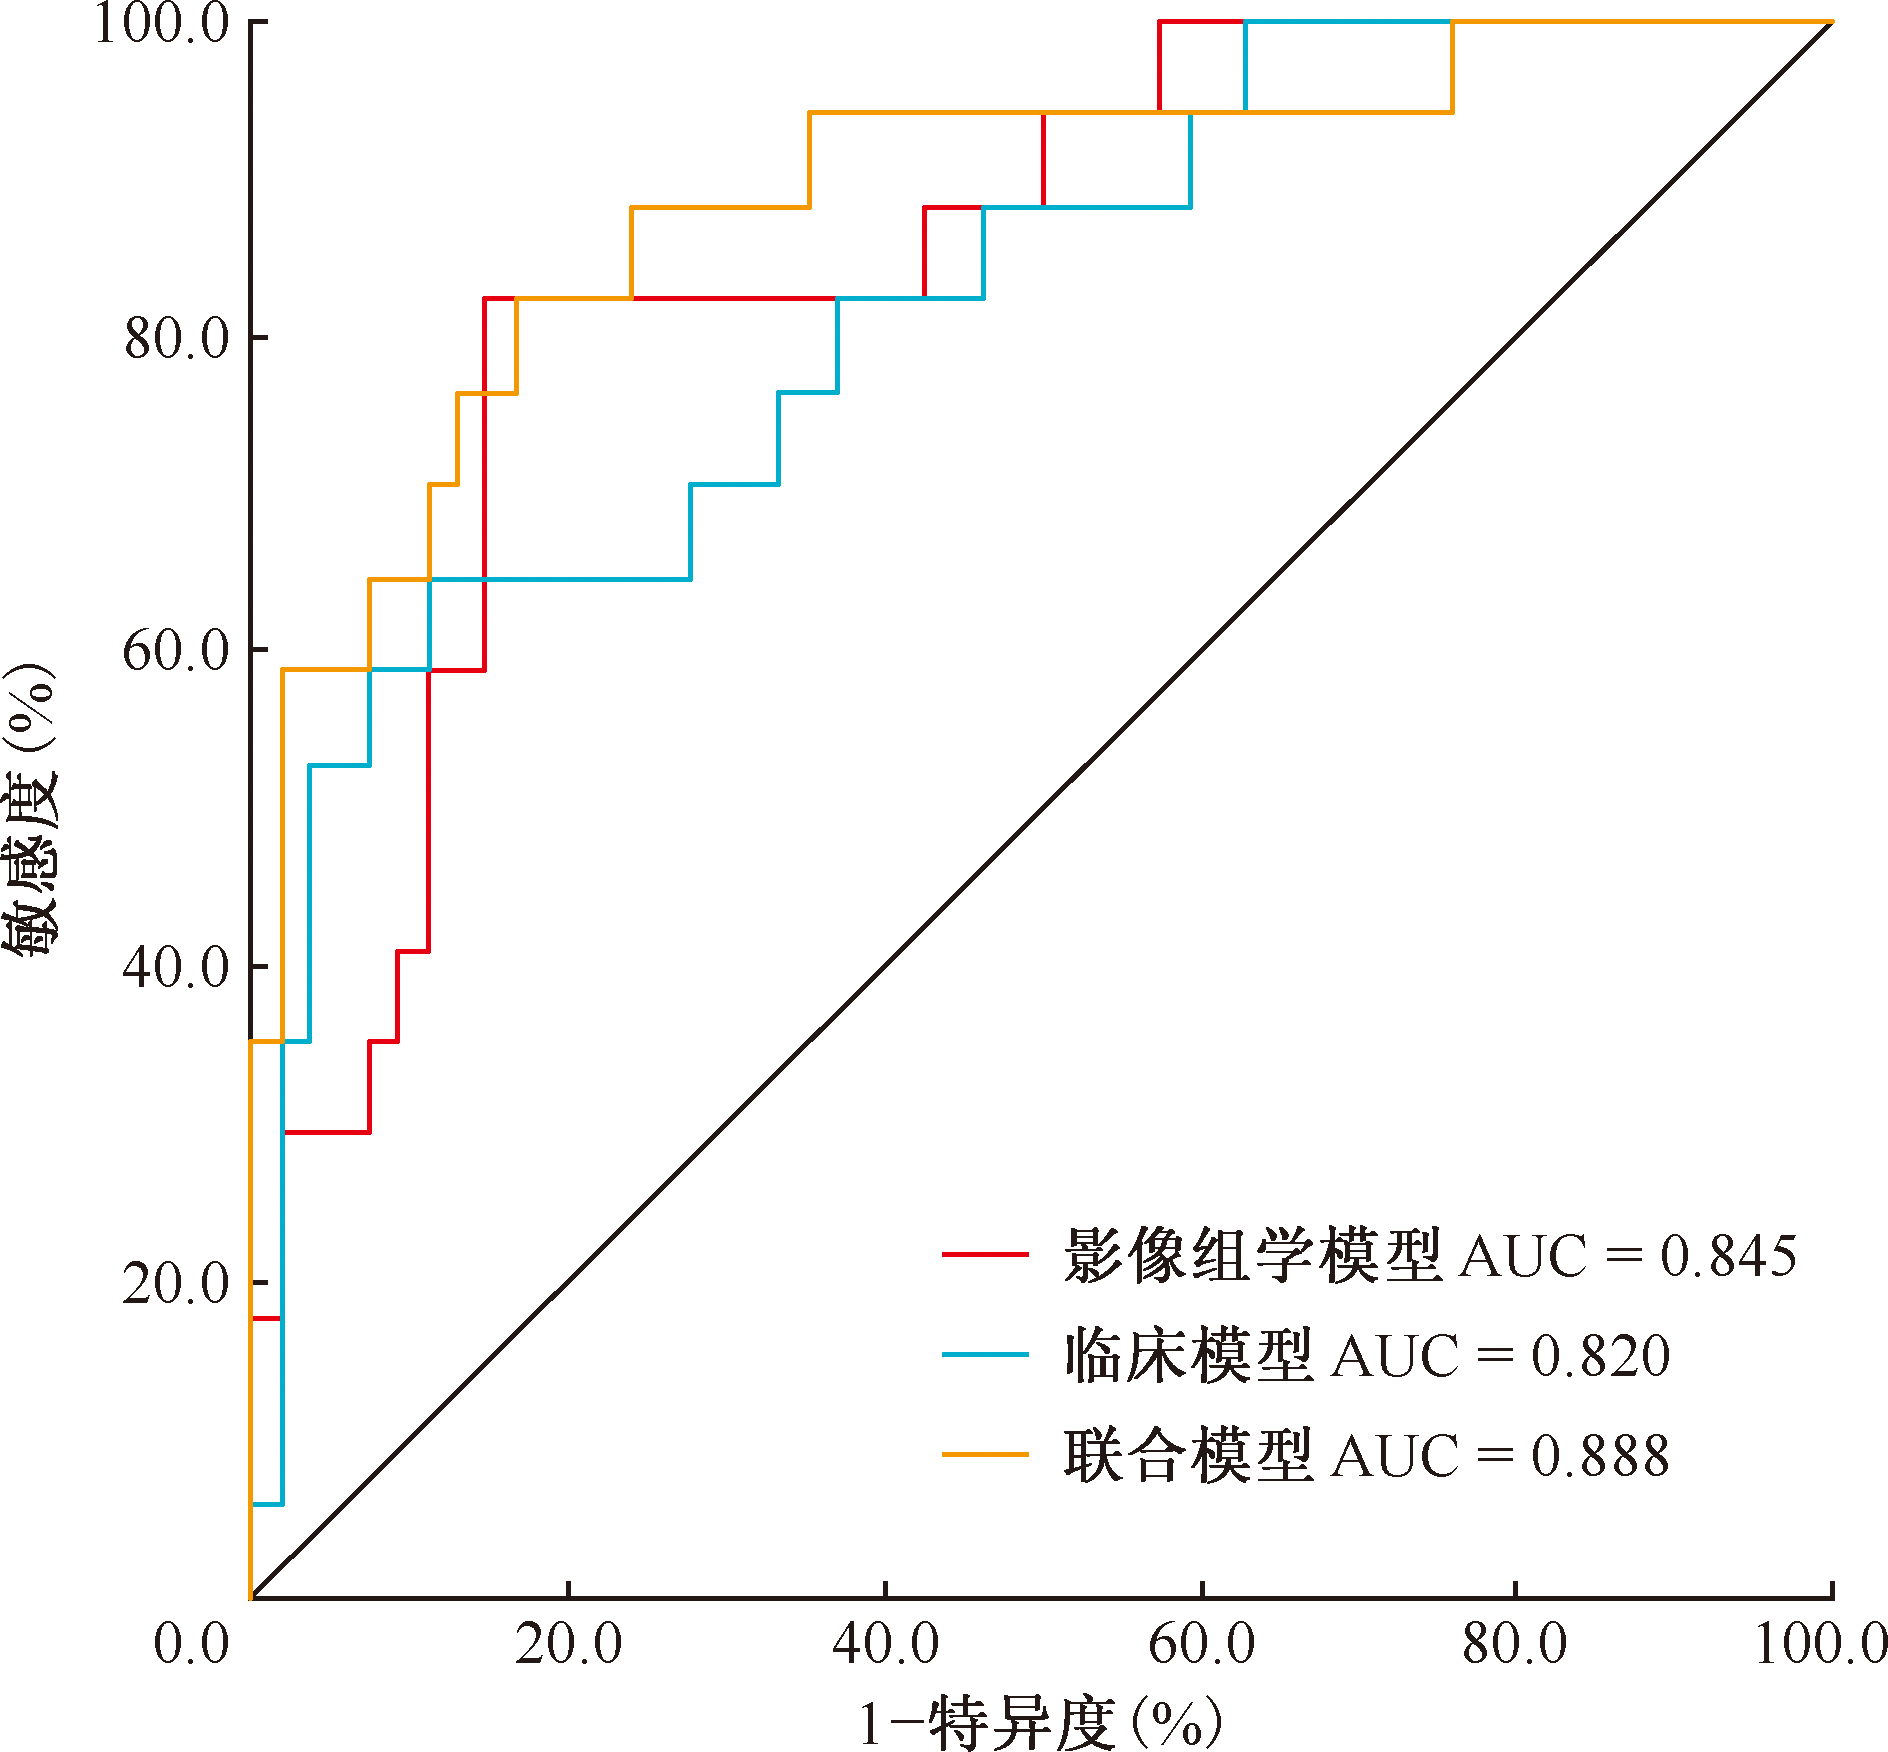
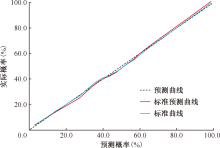
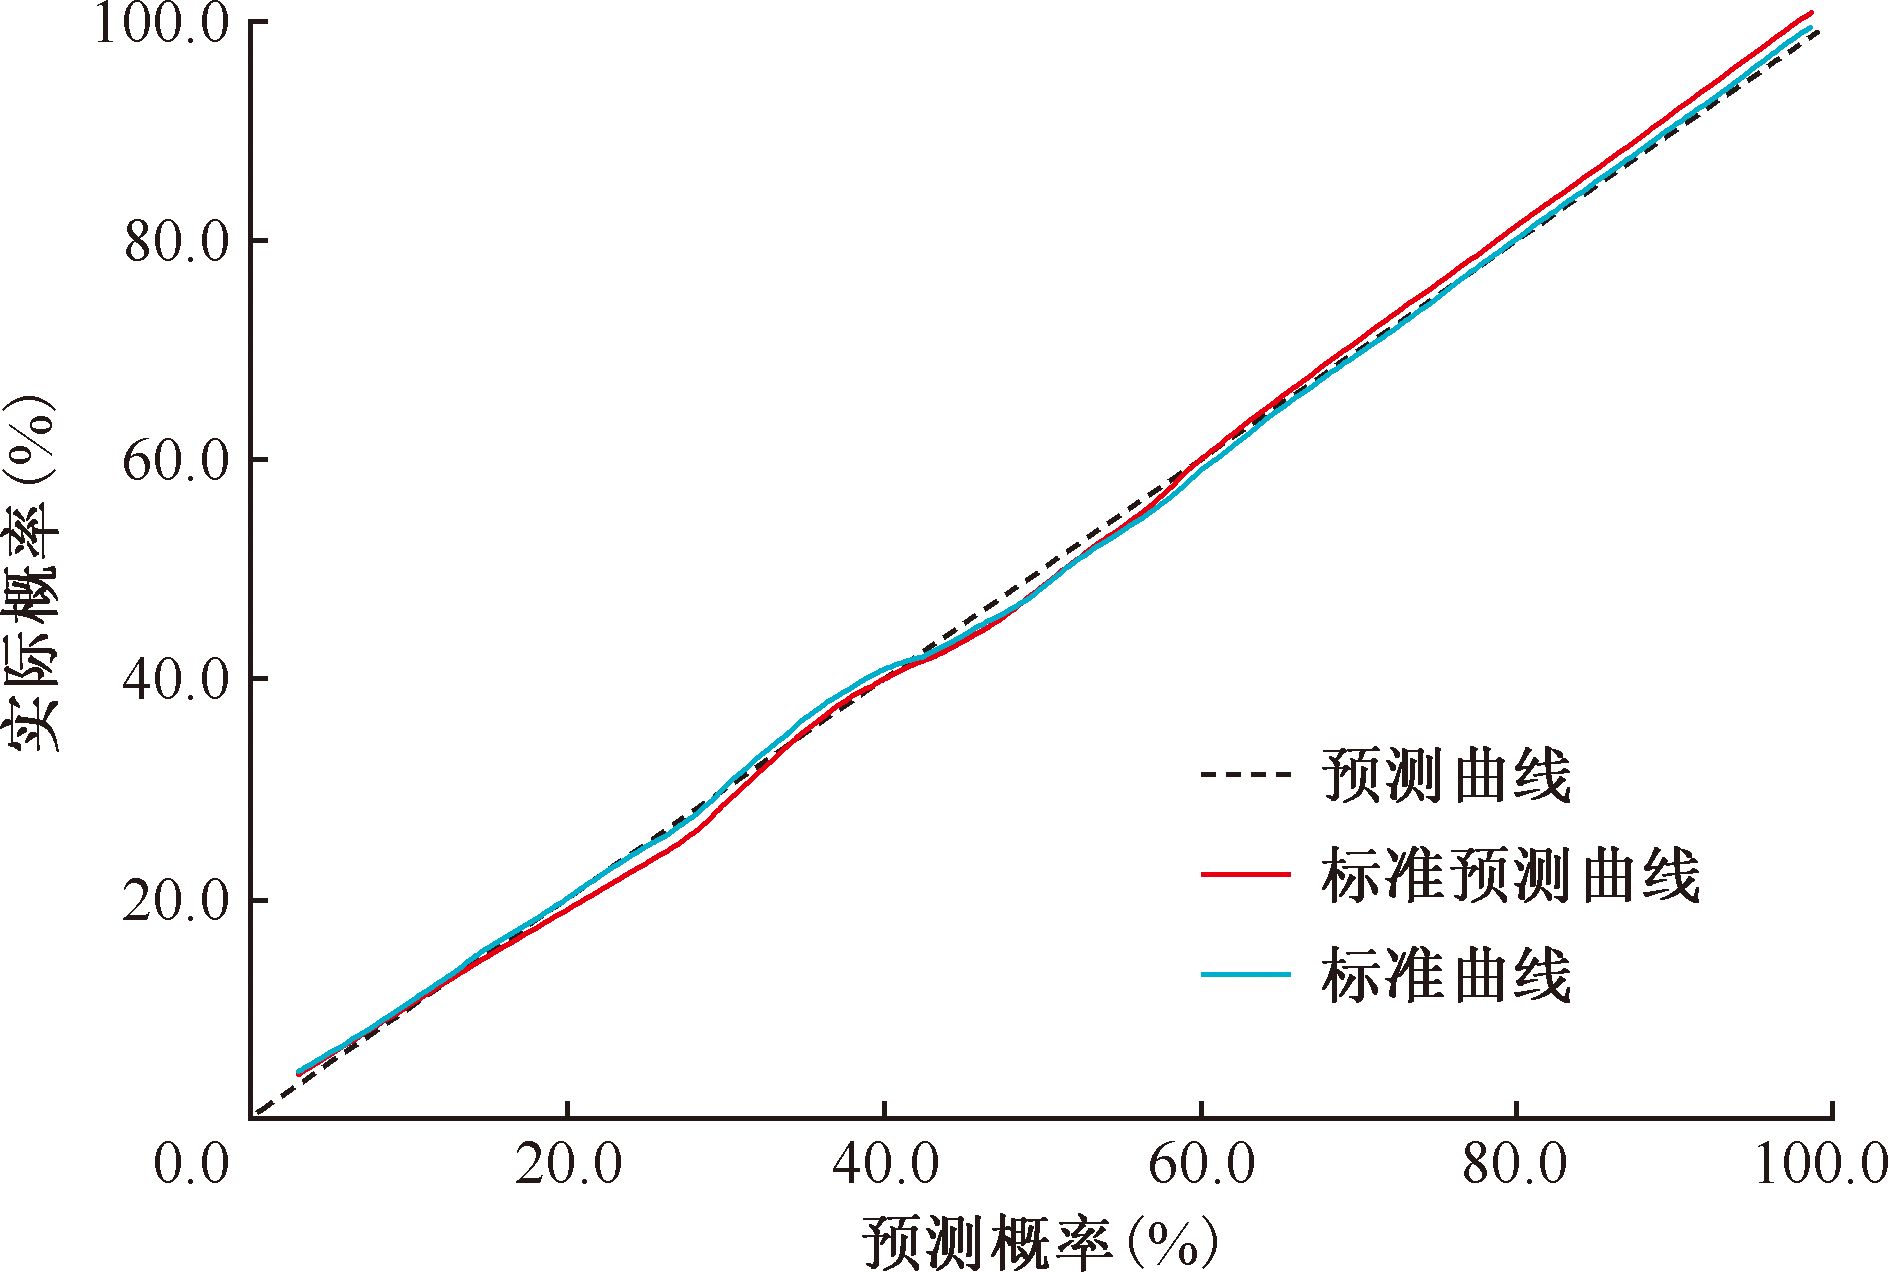
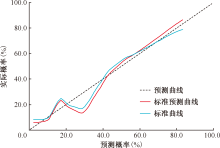
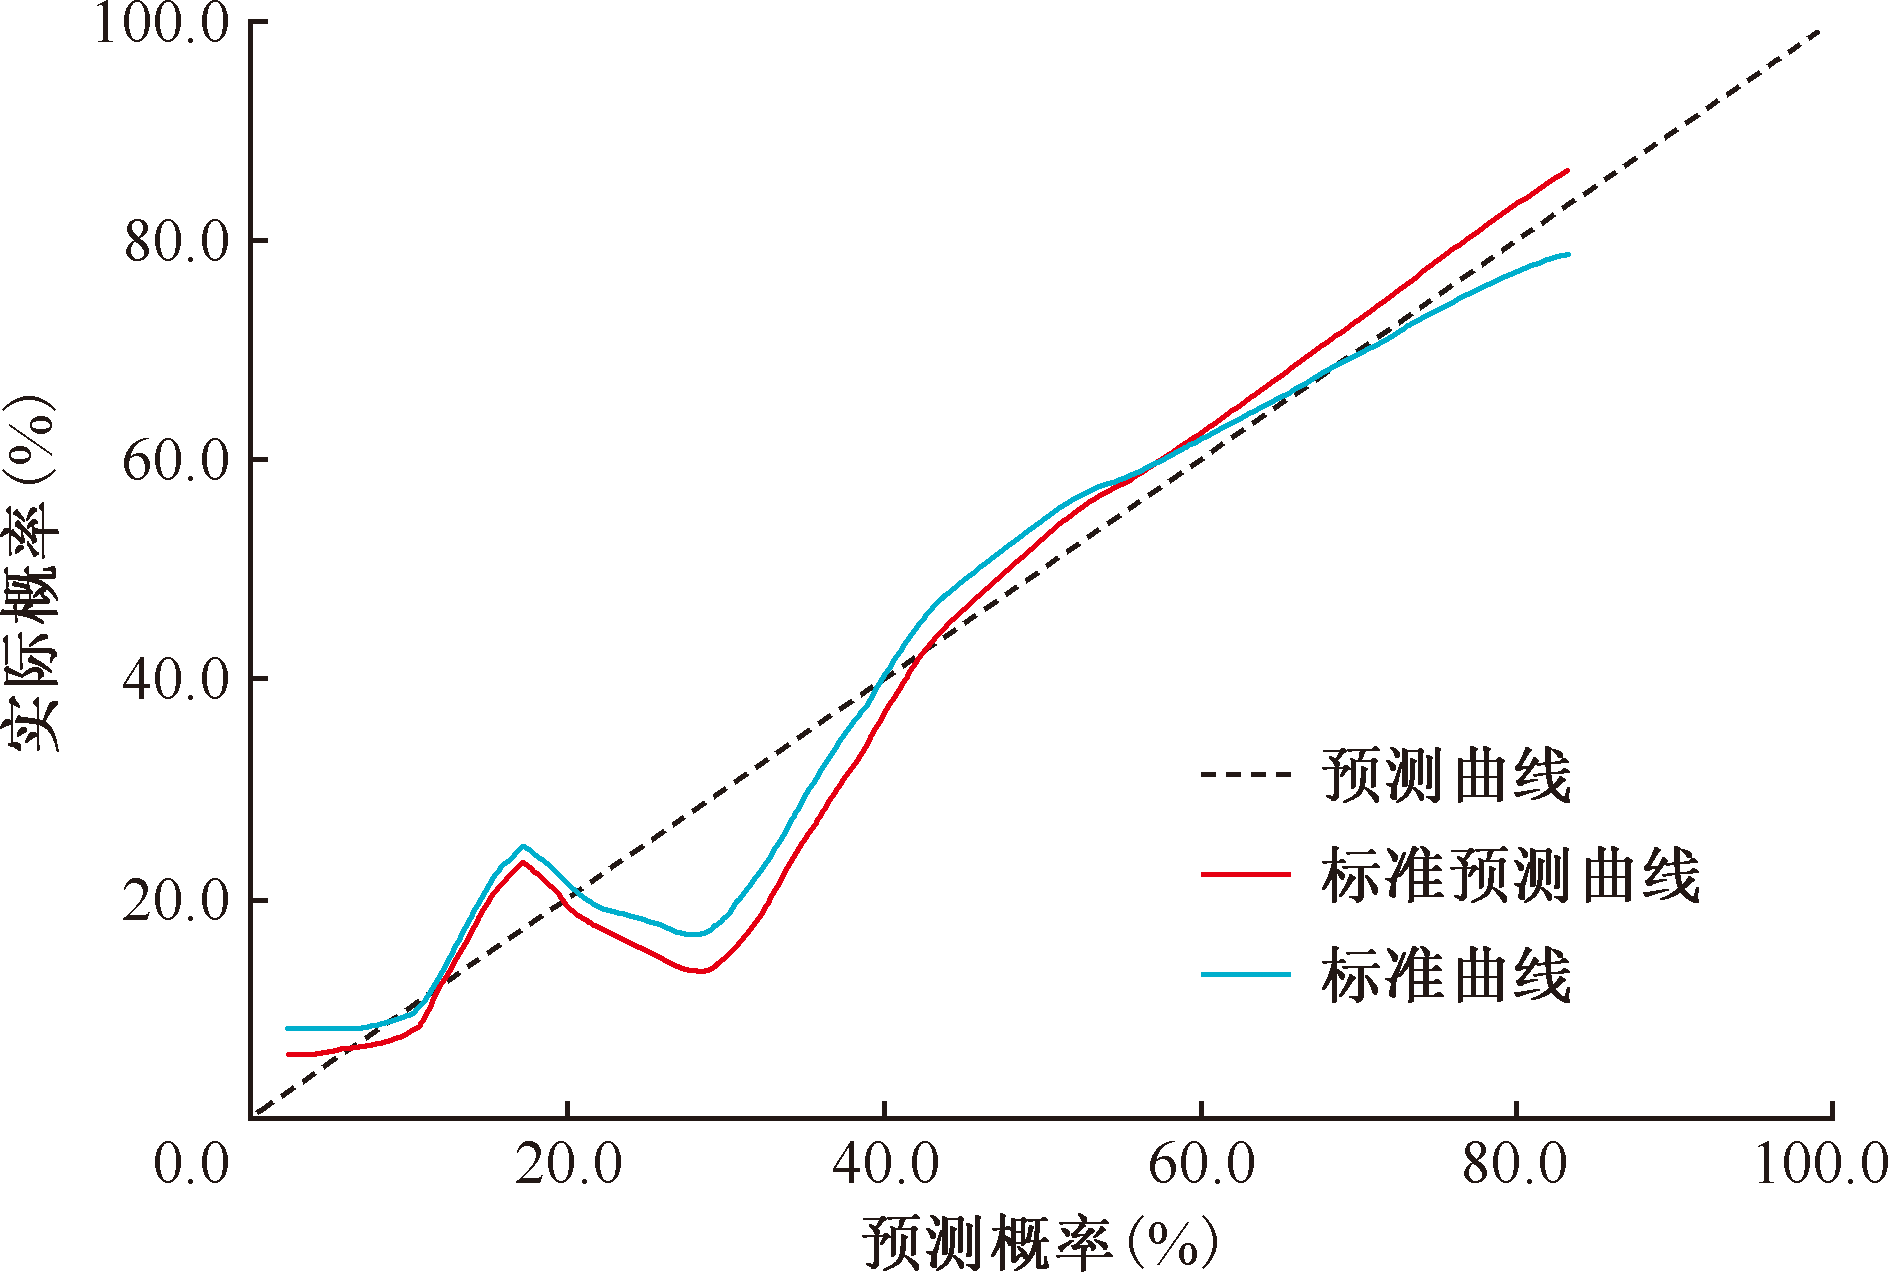
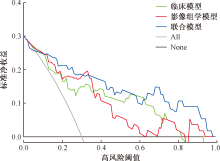
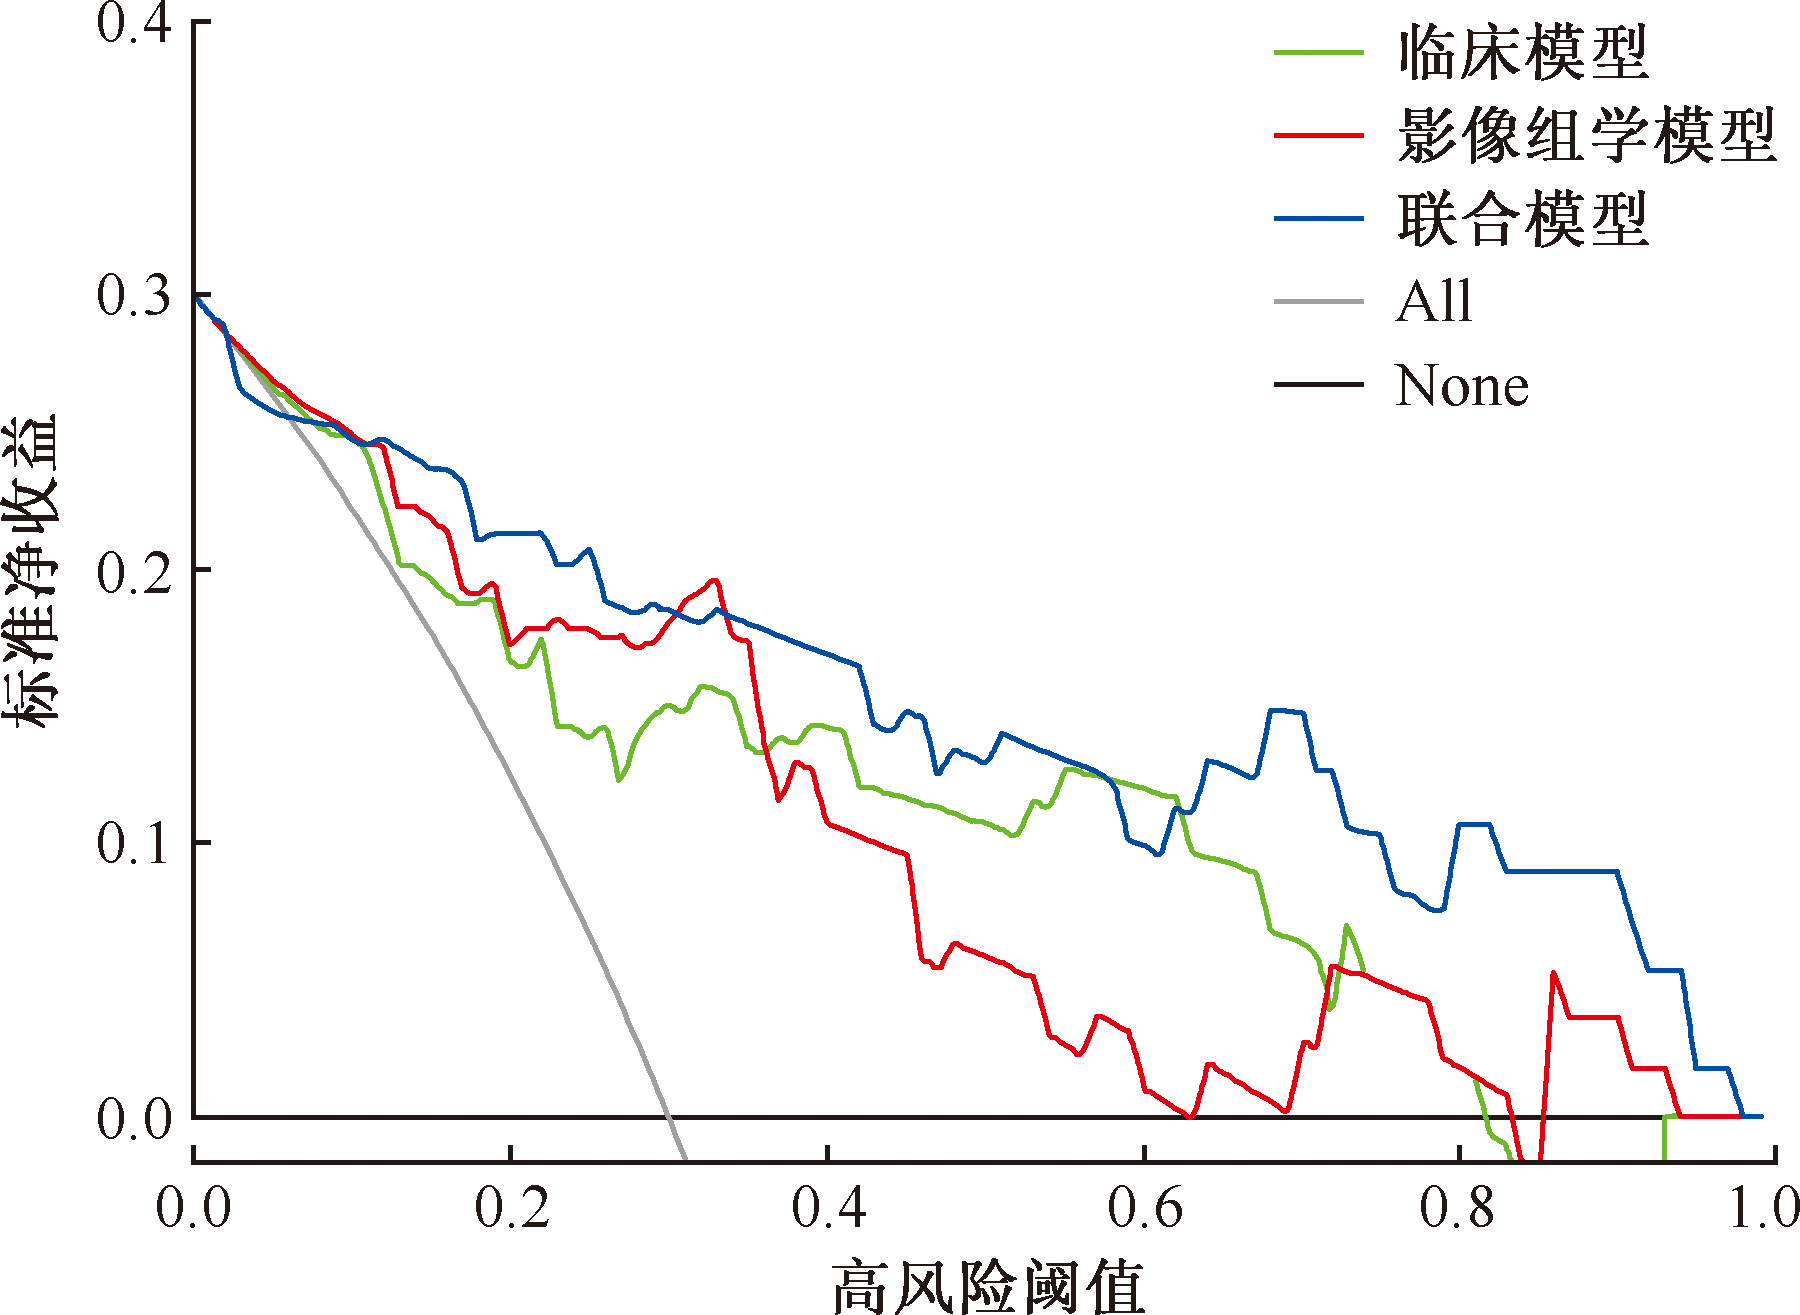
目的: 构建基于CT影像组学结合临床特征模型预测肺结核耐药性。方法: 选择2020年1月1日至2022年12月31日河南省新乡医学院第一附属医院收治的234例肺结核患者。根据耐药情况将患者分为耐药组88例和药物敏感组146例,并按照7∶3比例随机分为训练集和测试集。对病灶进行感兴趣体积(volume of interest, VOI)勾画后提取影像组学特征。应用最小冗余最大相关(minimum redundancy maximum relevance, MRMR)和最小绝对收缩与选择算子(least absolute shrinkage and selection operator, LASSO)方法进行特征筛选。利用logistics回归构建临床模型、影像组学模型,随后将经过筛选的最优影像组学特征和有统计学意义的临床特征、CT特征相结合,构建联合模型。应用受试者工作特征曲线下面积(areas under the receiver operating characteristic curve, AUC)评估每个模型的诊断性能。结果: 耐药组初治患者48例(54.55%)、复治患者40例(45.45%),树芽征检出率为69.32%(61/88)。药物敏感组初治患者131例(89.73%)、复治患者15例(10.27%),树芽征检出率为81.51%(119/146)。耐药组和药物敏感组患者临床特征及CT特征分析结果表明,治疗史(χ2=37.796,P<0.001)和树芽征(χ2=4.595,P=0.032)在两组间差异均有统计学意义。在CT征象分析中,2名医师对结节及卫星灶、钙化结节、实变、纤维条索、支气管扩张、树芽征的观察者间一致性较好(Kappa值分别为0.757、0.784、0.818、0.777、0.863、0.781)。应用MRMR和LASSO方法共筛选出14个影像组学特征作为预测指标构建预测模型。临床模型的AUC值在训练集和测试集分别为0.760(95%CI:0.687~0.834)和0.820(95%CI:0.704~0.937),影像组学模型的AUC值在训练集和测试集分别为0.822(95%CI:0.758~0.885)和0.845(95%CI:0.744~0.947),联合模型的AUC值在训练集和测试集分别为0.878(95%CI:0.823~0.932)和0.888(95%CI:0.788~0.987)。结论: 影像组学模型的诊断性能高于临床模型,联合模型的诊断性能在训练集和测试集表现最佳。

关键词: 结核,肺, 影像组学, 体层摄影术,X线计算机

Abstract:

Objective: To construct a model based on CT imaging radiomics combined with clinical features to predict the drug resistance of active pulmonary tuberculosis. Methods: The study included 234 patients with pulmonary tuberculosis admitted to The First Affiliated Hospital of Xinxiang Medical University from January 1, 2020 to December 31, 2022. Based on drug resistance status, the patients were divided into two groups: 88 cases in the drug-resistant group and 146 cases in the drug-sensitive group. They were then randomly assigned to a training set and a testing set in a ratio of 7∶3.Volume of interest (VOI) delineation was performed on the lesions, and radiomics features were extracted. Feature selection was conducted using the minimum redundancy maximum relevance (MRMR) and least absolute shrinkage and selection operator (LASSO) methods. Logistic regression was employed to establish clinical models and radiomics models separately. Subsequently, the selected optimal radiomics features, statistically significant clinical features, and CT features were combined to construct a joint model. The diagnostic performance of each model was evaluated using the area under the receiver operating characteristic curve (AUC). Results: Among the patients with drug resistance, there were 48 primary cases (54.55%) and 40 retreatment cases (45.45%). The detection rate of tree-in-bud sign was 69.32% (61/88). In the drug-sensitive group, there were 131 primary cases (89.73%) and 15 retreatment cases (10.27%). The detection rate of tree-in-bud sign was 81.51% (119/146). The clinical and CT feature analysis of patients in the drug-resistant and drug-sensitive group showed that there were statistically significant differences in treatment history (χ2=37.796, P<0.001) and tree-in-bud sign (χ2=4.595, P=0.032) between the two groups. Regarding CT findings analysis, the interobserver agreements between two physicians were good for the observation of nodules and satellite lesions, calcified nodules, consolidation, fibrotic bands, bronchial dilation, and tree-in-bud sign (Kappa coefficients were 0.757, 0.784, 0.818, 0.777, 0.863, and 0.781, respectively). A total of 14 radiomics features were selected as predictive indicators using the MRMR and LASSO methods to construct the prediction model. The AUC of the clinical model in the training set and testing set were 0.760 (95%CI: 0.687-0.834) and 0.820 (95%CI: 0.704-0.937), respectively. The AUC of the radiomics model in the training set and testing set were 0.822 (95%CI: 0.758-0.885)and 0.845 (95%CI: 0.744-0.947), respectively. The AUC of the combined model in the training set and testing set were 0.878 (95%CI: 0.823-0.932) and 0.888 (95%CI: 0.788-0.987), respectively. Conclusion: The radiomics model exhibited higher diagnostic performance than the clinical model, while the combined model showed the best diagnostic performance in both the training and testing sets.

Key words: Tuberculosis, pulmonary, Radiomics, Tomography, X-ray computed

中图分类号: