
Chinese Journal of Antituberculosis ›› 2026, Vol. 48 ›› Issue (2): 256-263.doi: 10.19982/j.issn.1000-6621.20250417
• Original Articles • Previous Articles Next Articles
Ji Yuanfei1, Yu Xia1, Wang Jue2, Sun Mengyan2, He Wei2, Lyu Yan2, Hou Dailun2( ), Li Chenghai2()
Received:2025-10-26
Online:2026-02-10
Published:2026-02-03
Contact:
Hou Dailun, Email: Supported by:CLC Number:
Ji Yuanfei, Yu Xia, Wang Jue, Sun Mengyan, He Wei, Lyu Yan, Hou Dailun, Li Chenghai. The CT imaging features of Mycobacterium avium-intracellulare pneumonia and the diagnostic evaluation of in non-tuberculous mycobacterium pneumonia[J]. Chinese Journal of Antituberculosis, 2026, 48(2): 256-263. doi: 10.19982/j.issn.1000-6621.20250417
Add to citation manager EndNote|Ris|BibTeX
URL: https://www.zgflzz.cn/EN/10.19982/j.issn.1000-6621.20250417
| CT征象 | MAC组 (138例) | 其他NTM组 (121例) | χ2值 | P值 | CT征象 | MAC组 (138例) | 其他NTM组 (121例) | χ2值 | P值 |
|---|---|---|---|---|---|---|---|---|---|
| 斑片影 | 134(97.10) | 108(89.26) | 6.470 | 0.011 | 支气管扩张 | 115(83.33) | 99(81.82) | 0.103 | 0.748 |
| 磨玻璃影 | 34(24.64) | 24(19.83) | 0.856 | 0.355 | |||||
| 支气管管壁增厚 | 132(95.65) | 110(90.91) | 2.365 | 0.124 | |||||
| 间质性改变 | 27(19.57) | 6(4.96) | 12.372 | <0.001 | |||||
| 树芽征 | 105(76.09) | 88(72.73) | 0.383 | 0.536 | |||||
| 肺实变 | 88(63.77) | 65(53.72) | 2.693 | 0.101 | |||||
| 小叶中心结节 | 126(91.30) | 106(87.60) | 0.946 | 0.331 | |||||
| 单发或多发结节 | 107(77.54) | 86(71.07) | 1.418 | 0.234 | |||||
| 肺索条影 | 134(97.10) | 119(98.35) | - | 0.688a | |||||
| 团块影 | 20(14.49) | 11(9.09) | 1.785 | 0.181 | |||||
| 并发叶性肺不张 | 11(7.97) | 11(9.09) | 0.104 | 0.747 | |||||
| 空洞 | 100(72.46) | 60(49.59) | 14.289 | <0.001 | |||||
| 肺损毁 | 13(9.42) | 13(10.74) | 0.125 | 0.724 | |||||
| 多发 | 71(51.45) | 39(32.23) | 9.745 | 0.002 | |||||
| 淋巴结肿大 | 55(39.86) | 30(24.79) | 6.634 | 0.010 | |||||
| 上叶 | 83(60.14) | 52(42.98) | 7.616 | 0.006 | |||||
| 淋巴结钙化 | 19(13.77) | 14(11.57) | 0.280 | 0.597 | |||||
| 薄壁(<3mm) | 72(52.17) | 53(43.80) | 1.810 | 0.179 | |||||
| 胸腔积液 | 32(23.19) | 28(23.14) | 0.000 | 0.993 | |||||
| 厚壁 | 90(65.22) | 43(35.54) | 22.734 | <0.001 | |||||
| 胸膜广泛增厚 | 78(56.52) | 45(37.19) | 9.662 | 0.002 | |||||
| 混合 | 61(44.20) | 38(31.40) | 4.472 | 0.034 | |||||
| 肺气肿 | 70(50.72) | 44(36.36) | 5.396 | 0.020 | |||||
| 牵拉邻近胸膜 | 81(58.70) | 51(42.15) | 7.063 | 0.008 | |||||
| 钙化 | 18(13.04) | 16(13.22) | 0.002 | 0.966 | |||||
| 邻近胸膜局限增厚 | 92(66.67) | 52(42.98) | 14.658 | <0.001 |

| CT征象 | β值 | Wald χ2值 | P值 | OR值 | 95%CI值 | |
|---|---|---|---|---|---|---|
| 斑片影 | 1.220 | 0.625 | 3.812 | 0.051 | 3.386 | 0.995~11.521 |
| 间质性改变 | 1.045 | 0.521 | 4.014 | 0.045 | 2.843 | 1.023~7.900 |
| 空洞 | ||||||
| 多发 | -0.161 | 0.419 | 0.147 | 0.701 | 0.851 | 0.374~1.937 |
| 上叶 | -0.581 | 0.487 | 1.425 | 0.233 | 0.559 | 0.216~1.452 |
| 厚壁 | 2.239 | 0.609 | 13.522 | <0.001 | 9.381 | 2.845~30.937 |
| 混合 | -1.452 | 0.574 | 6.407 | 0.011 | 0.234 | 0.076~0.721 |
| 牵拉邻近胸膜 | 0.447 | 0.462 | 0.938 | 0.333 | 1.564 | 0.633~3.864 |
| 淋巴结肿大 | 0.301 | 0.309 | 0.951 | 0.329 | 1.351 | 0.738~2.475 |
| 胸膜增厚 | 0.279 | 0.324 | 0.741 | 0.389 | 1.322 | 0.700~2.495 |
| 肺气肿 | 0.125 | 0.309 | 0.165 | 0.684 | 1.134 | 0.619~2.076 |

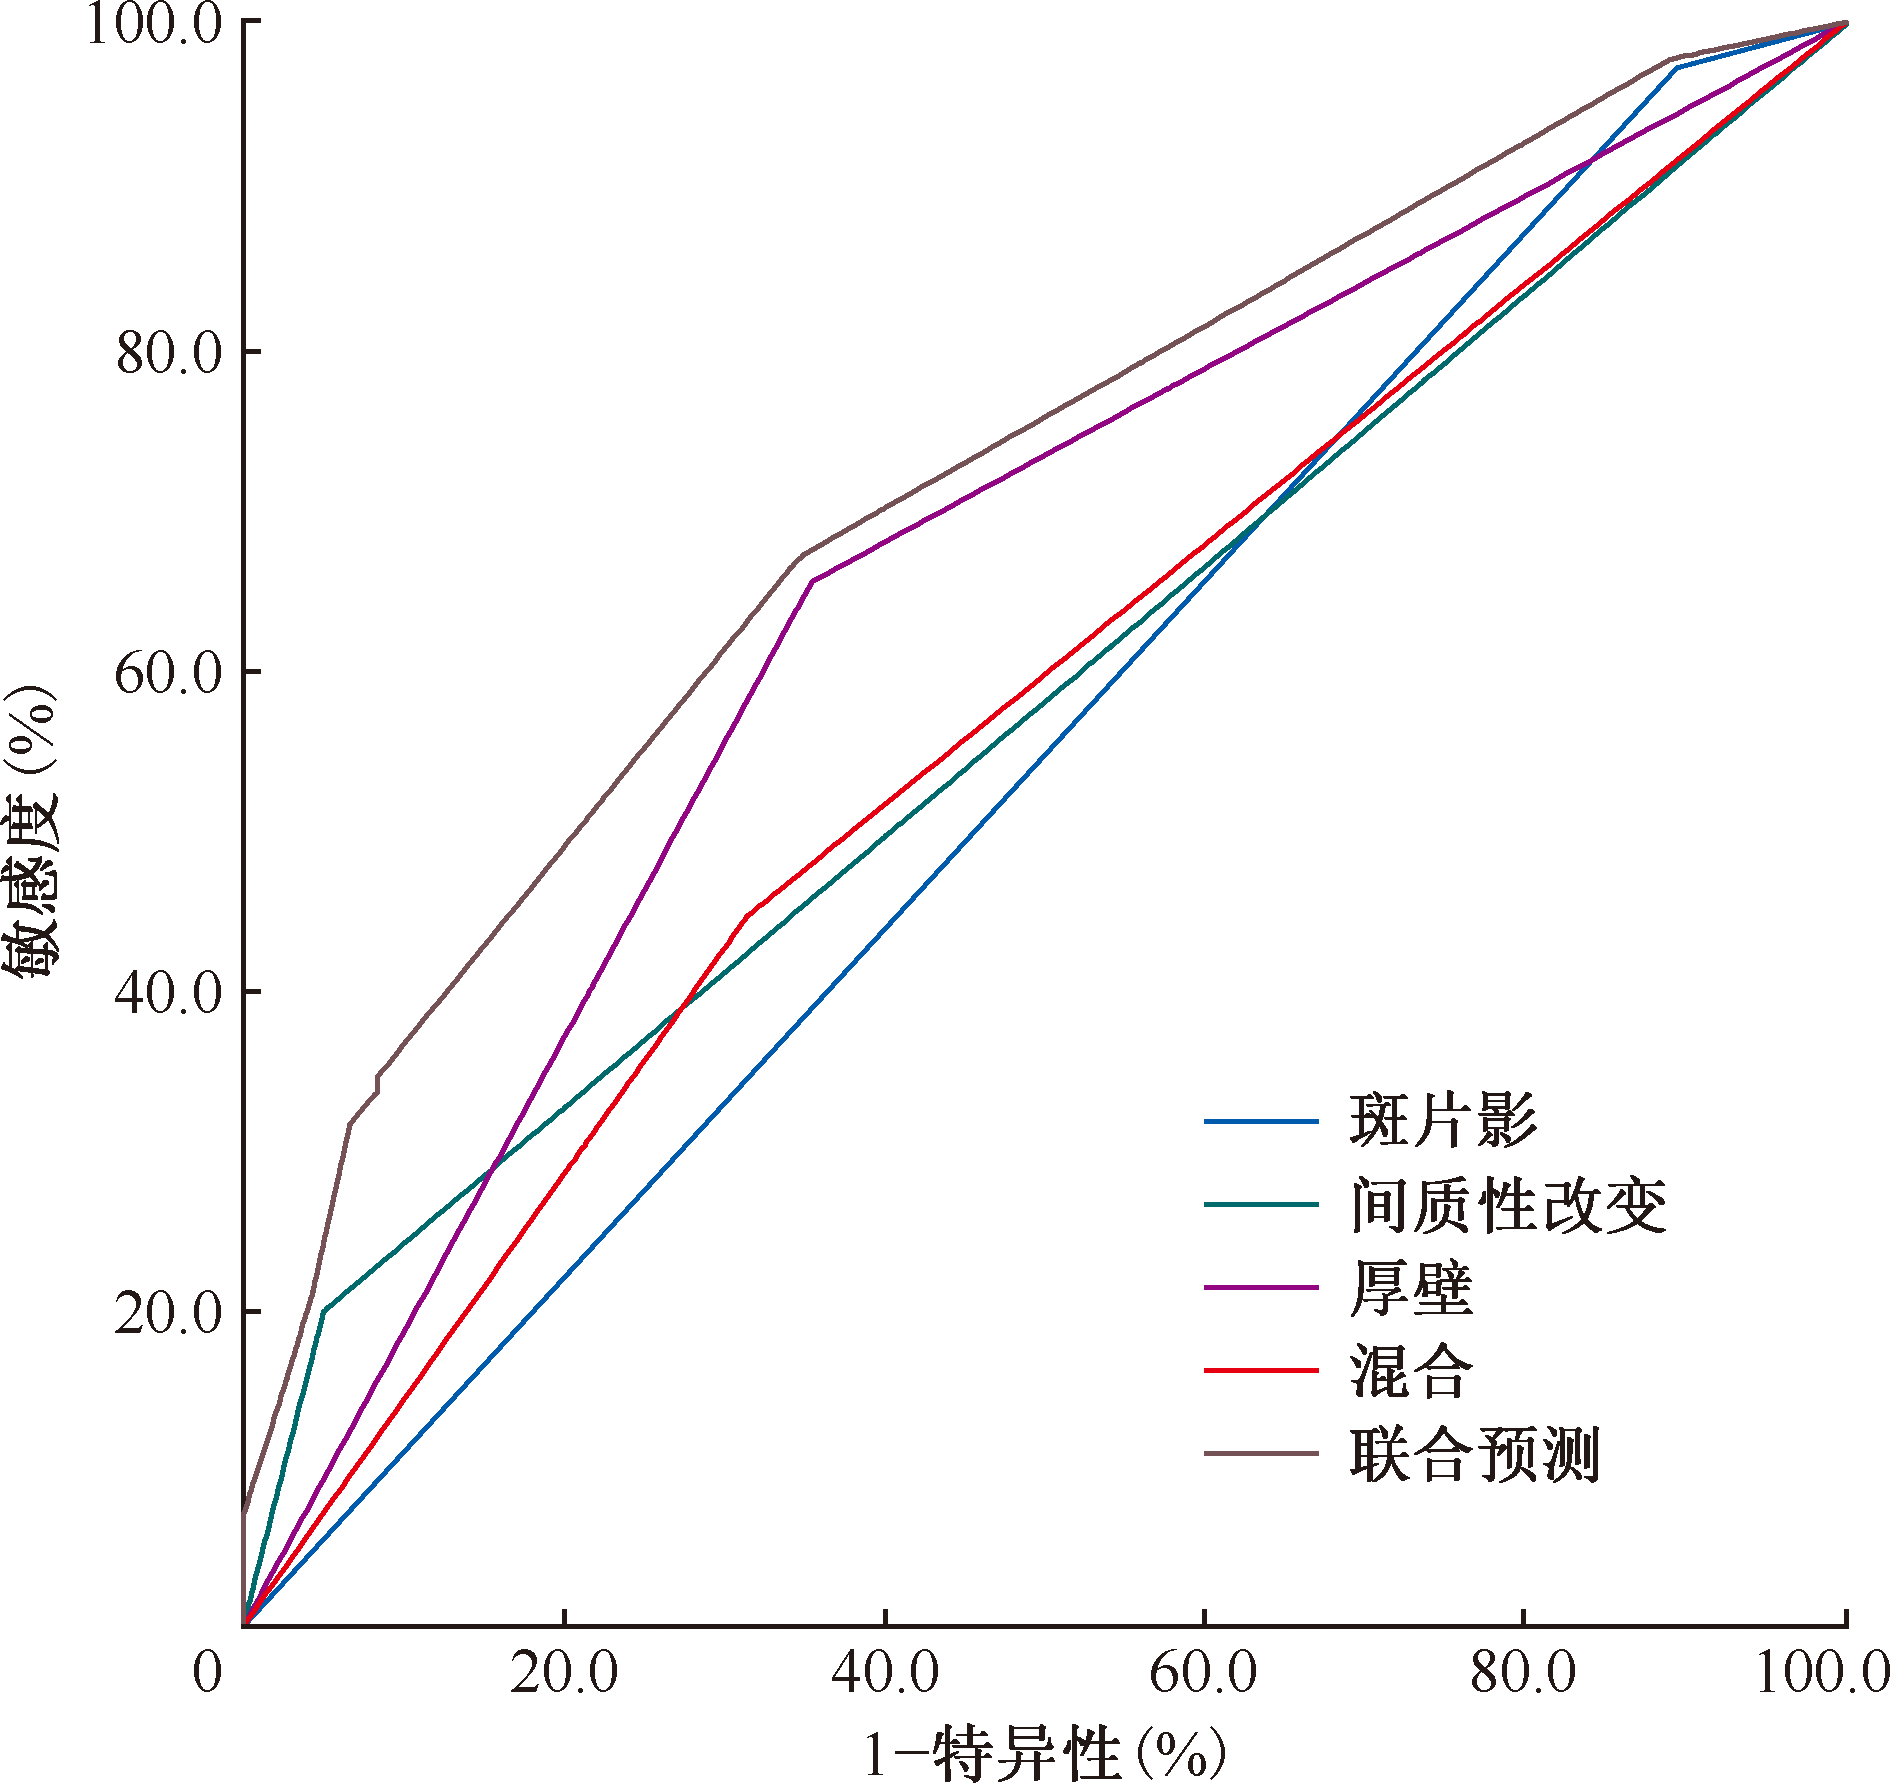
| CT征象 | AUC(95%CI)值 | Z值 | P值a | Z值 | P值b | Z值 | P值c | Z值 | P值d |
|---|---|---|---|---|---|---|---|---|---|
| 斑片影 | 0.539(0.469~0.610) | - | - | - | - | - | - | - | - |
| 间质性改变 | 0.573(0.504~0.642) | -1.349 | 0.177 | - | - | - | - | - | - |
| 厚壁空洞 | 0.648(0.581~0.716) | -3.337 | 0.001 | -2.296 | 0.022 | - | - | - | - |
| 混合空洞 | 0.564(0.494~0.634) | -0.749 | 0.454 | 0.265 | 0.791 | 4.300 | <0.001 | - | - |
| 联合 | 0.705(0.643~0.768) | -5.876 | <0.001 | -4.717 | <0.001 | -3.117 | 0.002 | -4.550 | <0.001 |
| [1] |
Zhang L, Lin TY, Liu WT, et al. Toward characterizing environmental sources of non-tuberculous mycobacteria (NTM) at the species level: A tutorial review of NTM phylogeny and phylogenetic classification. ACS Environ Au, 2024, 4(3): 127-141. doi:10.1021/acsenvironau.3c00074.
URL pmid: 38765059 |
| [2] | Van Der Laan R, Snabilié A, Obradovic M. Meeting the challenges of NTM-PD from the perspective of the organism and the disease process: innovations in drug development and delivery. Respir Res, 2022, 23(1): 376. doi:10.1186/s12931-022-02299-w. |
| [3] |
Tan Y, Deng Y, Yan X, et al. Nontuberculous mycobacterial pulmonary disease and associated risk factors in China: a prospective surveillance study. J Infect, 2021, 83(1): 46-53. doi:10.1016/j.jinf.2021.05.019.
URL pmid: 34048821 |
| [4] | Zo S, Choe J, Kim DH, et al. Long-term clinical course of Mycobacterium avium complex pulmonary disease patients with treatment failure. Antimicrob Agents Chemother, 2024, 68(12): e01055-24. doi:10.1128/aac.01055-24. |
| [5] | Daley CL, Winthrop KL. Mycobacterium avium complex: addressing gaps in diagnosis and management. J Infect Dis, 2020, 222(Supplement_4): S199-S211. doi:10.1093/infdis/jiaa354. |
| [6] | Daley CL, Iaccarino JM, Lange C, et al. Treatment of nontuberculous mycobacterial pulmonary disease: an official ATS/ERS/ESCMID/IDSA clinical practice guideline. Clin Infect Dis, 2020, 71(4): e1-e36. doi:10.1093/cid/ciaa241. |
| [7] | Ying C, Li X, Lv S, et al. T-SPOT with CT image analysis based on deep learning for early differential diagnosis of nontuberculous mycobacteria pulmonary disease and pulmonary tuberculosis. Int J Infect Dis, 2022, 125: 42-50. doi:10.1016/j.ijid.2022.09.031. |
| [8] | Dettmer S, Heiß-Neumann M, Wege S, et al. Evaluation of treatment response with serial CT in patients with non-tuberculous mycobacterial pulmonary disease. Eur Radiol, 2025, 35(2): 798-805. doi:10.1007/s00330-024-10987-y. |
| [9] | 中华医学会结核病学分会. 非结核分枝杆菌病诊断与治疗指南(2020年版). 中华结核和呼吸杂志, 2020, 43(11):918-946. doi:10.3760/cma.j.cn112147-20200508-00570. |
| [10] | van Ingen J, Obradovic M, Hassan M, et al. Nontuberculous mycobacterial lung disease caused by Mycobacterium avium complex-disease burden, unmet needs, and advances in treatment developments. Expert Rev Respir Med, 2021, 15(11): 1387-1401. doi:10.1080/17476348.2021.1987891. |
| [11] | Fujishima N, Komiya K, Yamasue M, et al. A Systematic Review of Factors Associated with Mortality among Patients with Mycobacterium avium Complex Lung Disease. Pathogens, 2023, 12(11): 1331. doi:10.3390/pathogens12111331. |
| [12] | Lou H, Zou A, Shen X, et al. Clinical features of nontuberculous mycobacterial pulmonary disease in the Yangtze river delta of China: a single-center, retrospective, observational study. Trop Med Infect Dis, 2023, 8(1): 50. doi:10.3390/tropicalmed8010050. |
| [13] | 中国研究型医院学会感染与炎症放射专业委员会, 中华医学会放射学分会传染病学组, 中国医师协会放射医师分会感染影像专业委员会, 等. 非结核分枝杆菌肺病影像诊断专家共识. 中国研究型医院, 2021, 8(3):1-6. doi:10.19450/j.cnki.jcrh.2021.03.001. |
| [14] | 李宝学, 夏奥伦, 秦立新, 等. 非结核分枝杆菌肺病MSCT影像学特征分析. 放射学实践, 2025, 40(3):319-324. doi:10.13609/j.cnki.1000-0313.2025.03.006. |
| [15] | 张亚楠, 段鸿飞. 鸟-胞内分枝杆菌复合群肺病的诊断和治疗进展. 中国防痨杂志, 2017, 39(10):1126-1129. doi:10.3969/j.issn.1000-6621.2017.10.018. |
| [16] | Takasaka N, Hosaka Y, Fukuda T, et al. Impact of emphysema on the prognosis of Mycobacterium avium complex pulmonary disease. Respir Med, 2022, 192: 106738. doi:10.1016/j.rmed.2022.106738. |
| [17] | 杨佳, 吕圣秀, 李春华, 等. 伴空洞的胞内分枝杆菌肺病与继发性肺结核的CT表现对比分析. 中国防痨杂志, 2019, 41(1):57-63. doi:10.3969/j.issn.1000-6621.2019.01.013. |
| [18] |
Mutsaers SE, Prele CM, Brody AR, et al. Pathogenesis of pleural fibrosis. Respirology, 2004, 9(4): 428-440. doi:10.1111/j.1440-1843.2004.00633.x.
URL pmid: 15612953 |
| [19] | Watanabe M, Hagiwara E, Shintani R, et al. Clinical characteristics of pulmonary Mycobacterium avium complex disease in patients with interstitial lung disease. J Infect Chemother, 2025, 31(1): 102515. doi:10.1016/j.jiac.2024.09.004. |
| [20] | 彭芸. 高分辨率CT在儿童间质性肺疾病诊断中的应用. 临床儿科杂志, 2012, 30(2):104-106. doi:10.3969/j.issn.1000-3606.2012.02.002. |
| [21] | Tomassetti S, Poletti V, Ravaglia C, et al. Incidental discovery of interstitial lung disease: diagnostic approach, surveillance and perspectives. Eur Respir Rev, 2022, 31(164): 210206. doi:10.1183/16000617.0206-2021. |
| [22] |
Antoniou KM, Margaritopoulos GA, Tomassetti S, et al. Interstitial lung disease. Eur Respir Rev, 2014, 23(131): 40-54. doi:10.1183/09059180.00009113.
URL pmid: 24591661 |
| [23] | Cho SJ, Stout-Delgado HW. Aging and lung disease. Annu Rev Physiol, 2020, 82(1): 433-459. doi:10.1146/annurev-physiol-021119-034610. |
| [24] |
Zhu F, Ying H, Siadat SD, et al. The gut-lung axis and microbiome dysbiosis in non-tuberculous mycobacterial infections: immune mechanisms, clinical implications, and therapeutic frontiers. Gut Pathog, 2025, 17(1): 40. doi:10.1186/s13099-025-00718-z.
URL pmid: 40481550 |
| [25] | Saito A, Horie M, Nagase T. TGF-β signaling in lung health and disease. Int J Mol Sci, 2018, 19(8): 2460. doi:10.3390/ijms19082460. |
| [26] | Kim JY, Bae J, Hyung K, et al. Significance of changes in cavity after treatment in Mycobacterium avium complex pulmonary disease. Sci Rep, 2024, 14(1): 21133. doi:10.1038/s41598-024-71971-6. |
| [27] | 王子奡, 姜慧杰, 赵升, 等. 肺空洞壁厚度特征和伴随 CT 征象在厚壁癌性和炎性肺空洞鉴别诊断价值研究. CT理论与应用研究, 2025, 34(3): 477-484. doi:10.15953/j.ctta.2024.250. |
| [28] | Kim C, Park SH, Oh SY, et al. Comparison of chest CT findings in nontuberculous mycobacterial diseases vs. Mycobacterium tuberculosis lung disease in HIV-negative patients with cavities. PLoS One, 2017, 12(3): e0174240. doi:10.1371/journal.pone.0174240. |
| [29] | Shin MK, Shin SJ. Genetic involvement of mycobacterium avium complex in the regulation and manipulation of innate immune functions of host cells. Int J Mol Sci, 2021, 22(6): 3011. doi:10.3390/ijms22063011. |
| [30] |
Biciusca T, Zielbauer AS, Anton T, et al. Differential radiological features of patients infected or colonised with slow-growing non-tuberculous mycobacteria. Scientific Reports, 2024, 14(1): 13295. doi:10.1038/s41598-024-64029-0.
URL pmid: 38858499 |
| [1] | Shang Yuanyuan, Nie Wenjuan, Chu Naihui. Comparison of clinical characteristics and prognostic factors between elderly and non-elderly patients with Mycobacterium abscessus pulmonary disease [J]. Chinese Journal of Antituberculosis, 2026, 48(1): 106-112. |
| [2] | Tan Xiao, Li Fangping, Zhang Qian, Zhang Meijia. Causal effects of gut microbiota on non-tuberculous mycobacterial lung infection: a bidirectional two-sample mendelian randomization study [J]. Chinese Journal of Antituberculosis, 2026, 48(1): 121-130. |
| [3] | Ren Hangkong, Sun Weifeng, Wang Linbao. Analysis of surgery effectiveness in treating chronic cavitary lung disease [J]. Chinese Journal of Antituberculosis, 2025, 47(9): 1180-1186. |
| [4] | Liu Yiping, Lin Youfei, Chen Xiaohong, Pan Jianguang. A case of pulmonary Castleman disease prone to misdiagnosis: a literature review [J]. Chinese Journal of Antituberculosis, 2025, 47(7): 921-929. |
| [5] | Gu Yuzhen, Chen Siyi, Huang Hairong, Yu Xia. Evaluation of in vitro activity of lefamulin against mycobacteria [J]. Chinese Journal of Antituberculosis, 2025, 47(6): 732-737. |
| [6] | Ying Guangzhi, Cai Qingshan, Ma Xiaoqing, Chen Lingyan, Chen Yuanyuan. Diagnostic value of Nanopore targeted sequencing for detecting nontuberculous mycobacteria in respiratory specimens [J]. Chinese Journal of Antituberculosis, 2025, 47(5): 589-596. |
| [7] | Song Feier, Mao Yanjun, Xia Qiuyue, Zhou Yang, Lin Huan. The prevalence and influencing factors of post-tuberculosis lung disease: A Meta-analysis [J]. Chinese Journal of Antituberculosis, 2025, 47(3): 322-330. |
| [8] | Zhao Yue, Wang Haoran, Cheng Meijin, Wang Wei, Liang Ruixia, Huang Hairong. The evaluation of the smear-positive and Xpert-negative outcome as an early indicator of nontuberculous mycobacteria existence in clinical specimen [J]. Chinese Journal of Antituberculosis, 2025, 47(1): 61-65. |
| [9] | Fan Jun, Wang Heng, Lan Tinglong, Dong Weijie, Tang Kai, Li Yuan, Yan Guangxuan, Xu Shangsheng, Kang Zhigang, Qin Shibing. Clinical characteristics and surgical outcomes of 12 cases of non-tuberculous mycobacterial spondylitis [J]. Chinese Journal of Antituberculosis, 2025, 47(1): 87-95. |
| [10] | Wang Fei, Hua Duo, Guo Jianjian, Liu Chang, Han Lu, Ren Yi. Characteristic analysis of non-tuberculous mycobacterial pulmonary disease patients in Wuhan area from 2021 to 2023 [J]. Chinese Journal of Antituberculosis, 2024, 46(9): 1069-1076. |
| [11] | Palidanguli Abudureheman, Wang Senlu, Gulina Badeerhan, Wang Le, Zulikatiayi Abudula, Wang Xinqi, Maiwulajiang Yimamu, Wang Xijiang. Distribution of Mycobacterium tuberculosis genotypes in Kashgar region and their association with clinical characteristics of pulmonary tuberculosis patients [J]. Chinese Journal of Antituberculosis, 2024, 46(9): 1077-1082. |
| [12] | Cai Qinghe, Fu Hui, Chen Ruiming, Fan Youming, Yang Qingwei. Analysis of the clinical characteristics and influencing factors of pulmonary tuberculosis patients with diabetes mellitus in Shantou City from 2016 to 2022 [J]. Chinese Journal of Antituberculosis, 2024, 46(8): 926-934. |
| [13] | Tan Shouyong. Research progress on comprehensive treatment beyond antibiotic therapy for nontuberculous mycobacterium pulmonary disease [J]. Chinese Journal of Antituberculosis, 2024, 46(8): 967-970. |
| [14] | Chai Dongyu, Qin Shuyi, Zhang Ronghua, Zou Nannan, Wang Xin. Analysis of risk factors for viral pneumonia combined with invasive pulmonary mycosis [J]. Chinese Journal of Antituberculosis, 2024, 46(7): 750-755. |
| [15] | Han Wenya, Zhou Yangyu, Wang Meifang, Xue Xinying. Progress in clinical diagnosis and treatment of pulmonary cryptococcosis [J]. Chinese Journal of Antituberculosis, 2024, 46(7): 830-838. |
| Viewed | ||||||
|
Full text |
|
|||||
|
Abstract |
|
|||||
 京公网安备11010202007215号
Total visitors: Visitors of today: Now online:
京公网安备11010202007215号
Total visitors: Visitors of today: Now online:
 This work is licensed under Creative Commons Attribution 3.0 License.