Email Alert | RSS    帮助

中国防痨杂志 ›› 2020, Vol. 42 ›› Issue (4): 327-334.doi: 10.3969/j.issn.1000-6621.2020.04.006

• 论著 • 上一篇    下一篇

2014—2018年广州市肺结核发病空间分布特征分析

赖铿,吴桂锋,雷宇,谢玮,王挺,钟敏儿,杜雨华()   

  1. 510030 广州市胸科医院结核病控制管理科(赖铿、吴桂锋、雷宇、王挺、钟敏儿、杜雨华),预防保健科(谢玮)
  • 收稿日期:2020-02-18 出版日期:2020-04-10 发布日期:2020-04-07
  • 通信作者: 杜雨华 E-mail:du.yuhua@163.com
  • 基金资助:
    “十三五”国家科技重大专项(2018ZX10715004-002-017);广州市高水平临床重点专科和培育专科建设项目(穗卫函[2019]1555号);广东省转化医学创新平台培育建设项目(粤卫函[2018]1254号);广州市卫生健康科技重大项目(2020A031003)

Analysis of spatial distribution characteristics of tuberculosis in Guangzhou from 2014 to 2018

LAI Keng,WU Gui-feng,LEI Yu,XIE Wei,WANG Ting,ZHONG Min-er,DU Yu-hua()   

  1. Department of Tuberculosis Control and Management, Guangzhou Chest Hospital, Guangzhou 510030, China
  • Received:2020-02-18 Online:2020-04-10 Published:2020-04-07
  • Contact: Yu-hua DU E-mail:du.yuhua@163.com

摘要:

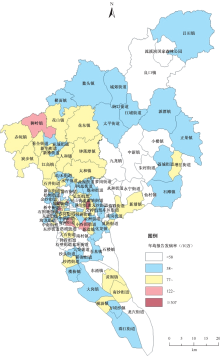
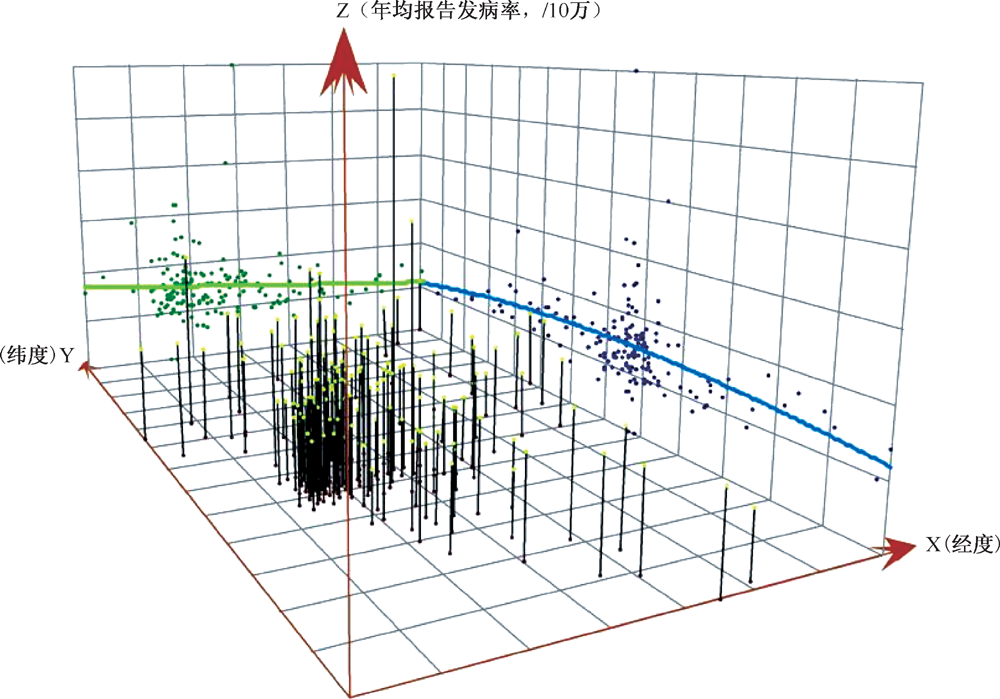
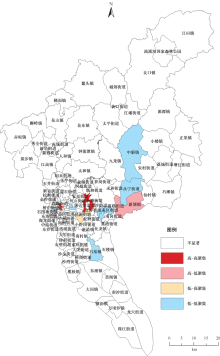
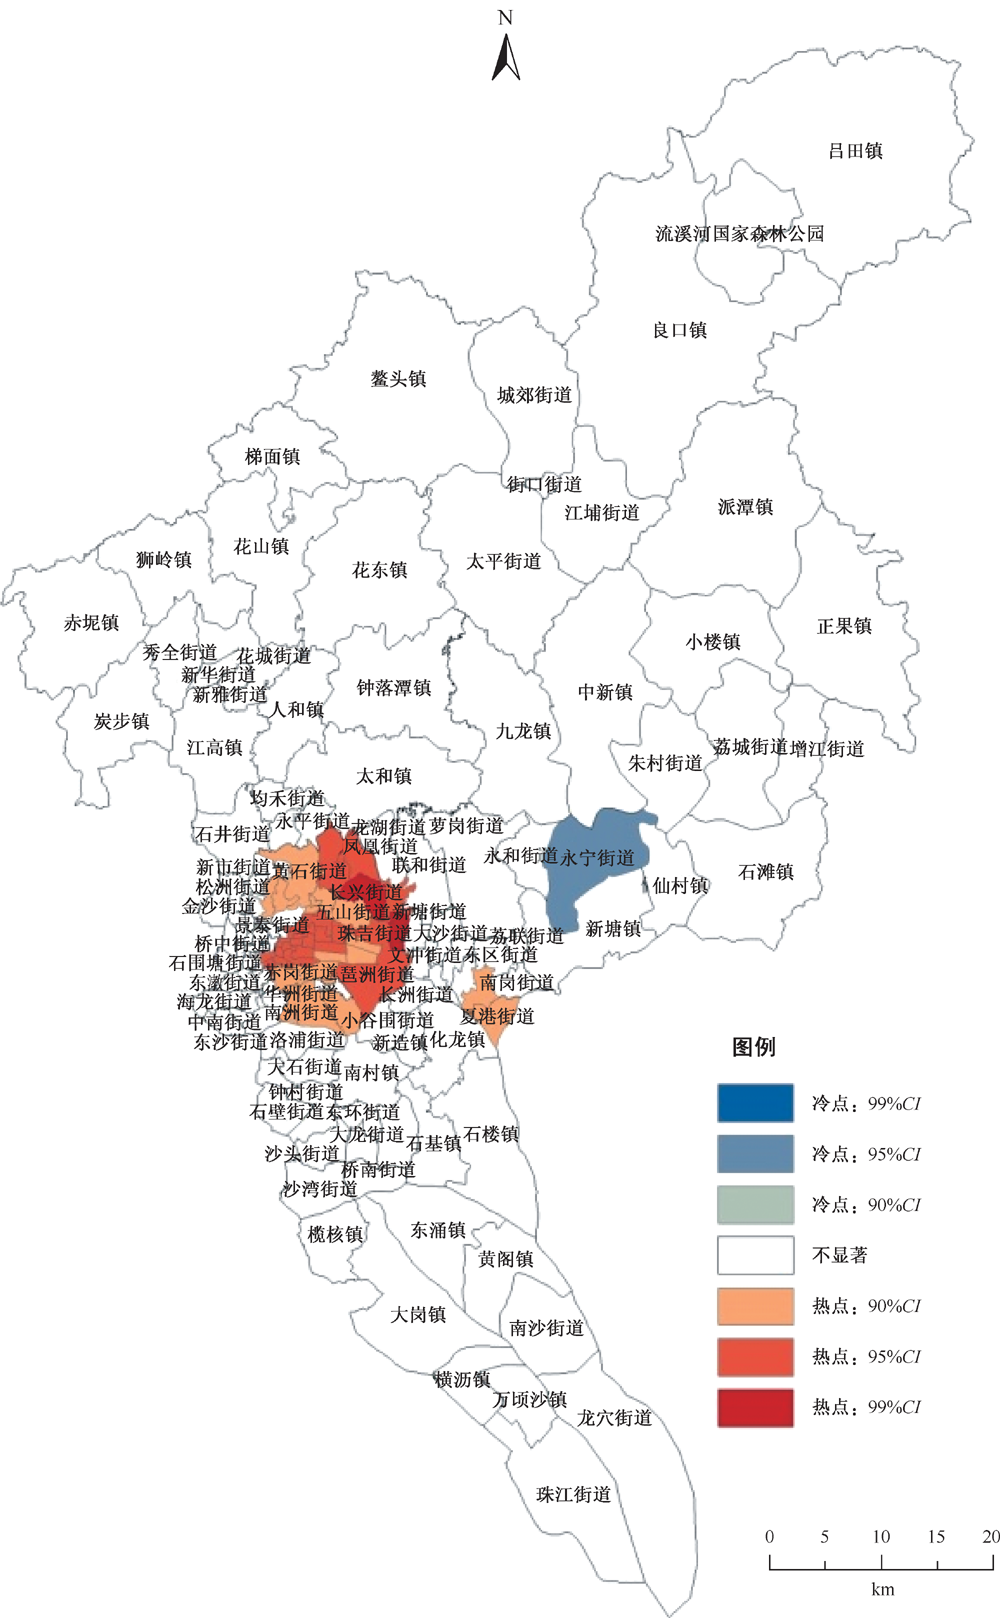
目的 从街道/乡镇水平上分析2014—2018年广州市肺结核发病空间分布特征。 方法 通过《中国疾病预防控制信息系统》的子系统《传染病报告信息管理系统》收集2014—2018年广州市肺结核传染病报告卡报告的54213例患者的信息,在街道/乡镇水平上绘制空间分布地图,进行趋势分析、全局及局部空间自相关分析,探索其空间分布规律及发病热点区域。 结果 2014—2018年广州市肺结核平均报告发病率为79.87/10万(54213/67876663)。三维趋势分析图显示,2014—2018年广州市肺结核年均报告发病率由西向东逐渐降低,在南北分布上呈微弱的“n”形分布,即中部高,南北低。在街道/乡镇水平上,广州市2014—2018年肺结核发病整体呈现出空间聚集性,各年度莫兰指数(Moran I)值分别为0.093、0.275、0.137、0.091、0.107,Z值分别为2.028、5.879、2.949、2.156、2.619,P值分别为0.034、0.001、0.008、0.027、0.005。全局Getis-Ord G指数为0.006,Z值为2.632,P值为0.008,提示广州市肺结核年均报告发病率空间整体呈“高-高”聚集分布。局部空间自相关指标聚集地图发现,高-高聚集区为越秀区的珠光街道、洪桥街道、大塘街道、北京街道和天河区的珠吉街道、新塘街道、车陂街道。局部冷热点分析发现,存在29个热点街道,主要集中在天河区和越秀区。 结论 2014—2018年广州市肺结核发病在街道/乡镇水平上呈现空间聚集性,整体表现为“高-高”聚集模式,且发病热点主要集中在天河区和越秀区。

关键词: 结核,肺, 空间自相关分析, 流行病学研究特征(主题)

Abstract:

Objective To analyze the spatial distribution characteristics of tuberculosis (TB) at the street/township level in Guangzhou from 2014 to 2018. Methods The information of 54213 TB patients who reported on the TB infectious disease report card in Guangzhou City from 2014 to 2018 was collected through “China Disease Prevention and Control Information System and Infective Diseases Management Information System”. Based on the street/township level, the spatial distribution map was drawn, and then the trend analysis as well as the global and local spatial autocorrelation analysis were conducted to explore the spatial distribution pattern and hot areas of TB. Results The average annual reported incidence rate of TB was 79.87/100000 (54213/67876663) in Guangzhou from 2014 to 2018. The three-dimensional trend analysis chart showed that the average annual reported incidence of TB in Guangzhou from 2014 to 2018 gradually decreased from the west to the east, and showed a weak “n” shape in the north-south distribution, that was, high in the middle and low in the north and south. At the street/township level, the overall incidence of TB in Guangzhou from 2014 to 2018 showed spatial clustering. The values of Moran’s I were 0.093, 0.275, 0.137, 0.091 and 0.107, respectively, and Z values were 2.028, 5.879, 2.949, 2.156 and 2.619, respectively, with P values of 0.034, 0.001, 0.008, 0.027, and 0.005, respectively. General Getis-Ord G index was 0.006, Z value was 2.632, and P value was 0.008, which suggested that the spatial distribution of the annual reported incidence of TB in Guangzhou presented a “high-high” clustering. According to the local spatial autocorrelation index aggregation map, the high-high clusters included 7 streets as follows: Zhuguang, Hongqiao, Datang and Beijing Streets in Yuexiu District, Zhuji, Xintang and Chebei Streets in Tianhe District. Partial hot/cold spot analysis showed that there were 29 hotspot streets, mainly concentrated in Tianhe and Yuexiu Districts. Conclusion Incidence rates of TB displayed spatial clustering at the street/township level in Guangzhou during 2014 to 2018, with the overall performance of “high-high” clustering pattern, and the incidence hotspots were mainly concentrated in Tianhe and Yuexiu Districts.

Key words: Tuberculosis,pulmonary, Spatial autocorrelation analysis, Epidemiologic study characteristics as topic