Email Alert | RSS    帮助

中国防痨杂志 ›› 2023, Vol. 45 ›› Issue (12): 1170-1176.doi: 10.19982/j.issn.1000-6621.20230287

• 论著 • 上一篇    下一篇

2011—2022年天津市肺结核时空分布特征分析

张文倩1,2, 黄飞3, 张国钦2, 庞学文2, 张帆2()   

  1. 1中国疾病预防控制中心中国现场流行病学培训项目,北京 100050
    2天津市结核病控制中心,天津 300041
    3中国疾病预防控制中心结核病预防控制中心,北京102206
  • 收稿日期:2023-08-11 出版日期:2023-12-10 发布日期:2023-11-27
  • 通信作者: 张帆,Email:zhangfan66@tj.gov.cn
  • 基金资助:
    中国现场流行病学培训项目

Temporal-spatial distribution of pulmonary tuberculosis in Tianjin during 2011—2022

Zhang Wenqian1,2, Huang Fei3, Zhang Guoqin2, Pang Xuewen2, Zhang Fan2()   

  1. 1Chinese Field Epidemiology Training Program, Chinese Center for Disease Control and Prevention, Beijing 100050, China
    2Tianjin Center for Tuberculosis Control, Tianjin 300041, China
    3National Center for Tuberculosis Control and Prevention, Chinese Center for Disease Control and Prevention, Beijing 102206, China
  • Received:2023-08-11 Online:2023-12-10 Published:2023-11-27
  • Contact: Zhang Fan, Email:zhangfan66@tj.gov.cn
  • Supported by:
    Chinese Field Epidemiology Training Program

摘要:

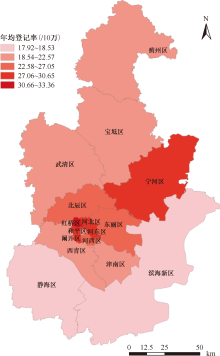
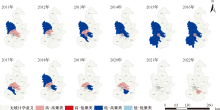
目的: 分析2011—2022年天津市肺结核时空分布特征和聚集性,为提高天津市肺结核防治工作水平、制定区域性结核病控制策略提供理论依据。方法: 通过“中国疾病预防控制信息系统”子系统“结核病管理信息系统”和天津市统计年鉴及“中国传染病监测信息报告管理系统”获得2011—2022年登记报告现住址为天津市的肺结核登记率、患者资料(患者发病登记时间和现住址)、行政区域,以及天津市相关人口学信息。采用SPSS 26.0、ArcGIS 10.7和SaTScan 10.1软件对天津市肺结核登记率进行全局和局部空间自相关及时空扫描聚集性分析。结果: 2011—2022年天津市肺结核登记率介于20.40/10万(2801/13730000)~26.42/10万(3543/13410000),差异无统计学意义($x^{2}_{趋势}=1.144$,P=0.233),年均登记率为23.82/10万(39907/167506000),年均递降率为2.32%$\left[\left(\sqrt[11]{\frac{20.40}{26.42}}-1\right) \times 100 \%\right]$。2012—2016年肺结核年登记率在23.15/10万(3190/13780000)~25.16/10万(3548/14100000)之间,存在空间聚集性(Moran’s I指数=0.138、0.228、0.130、0.238和0.288,Z=2.474、3.625、2.417、3.732和4.368,P=0.013、<0.001、0.016、<0.001和<0.001)。局部空间自相关分析显示,天津市仅2021年未形成各地区肺结核聚集区,其他年份均形成高-高(HH)和低-高(LH)两种聚集模式,其中,高-高聚集主要集中在市内六区(和平区、河西区、河东区、南开区、河北区、红桥区)和环城四区(北辰区、东丽区、西青区、津南区)。时空扫描结果显示存在2个聚集区,一级聚集区主要集中在2011—2016年的市内六区(LLR=383.11,RR=1.42,P<0.001),二级聚集区集中在2014—2019年的滨海新区(LLR=27.12,RR=1.32,P<0.001)。结论: 2011—2022年天津市肺结核疫情趋于稳定,但在2012—2016年间存在空间聚集性,高-高聚集多集中在市内六区和环城四区,且在市内六区和滨海新区出现时空聚集性,应关注人口流动性大、人口稠密和经济发展重心地区的结核病疫情变化,提高地区诊断鉴别水平和探索主动发现策略,因地制宜调整结核病防治策略。

关键词: 结核,肺, 时空聚类分析, 流行病学研究, 数据说明,统计, 天津

Abstract:

Objective: To analyze the spatial-temporal distribution and clustering characteristic of pulmonary tuberculosis (PTB) in Tianjin from 2011 to 2022, and provide a theoretical basis for improving the level of tuberculosis control and development of tuberculosis control strategies. Methods: Through the “China Disease Prevention and Control Information System” subsystem “Tuberculosis Management Information System” and Tianjin Statistical Yearbook and China Infectious Disease Surveillance Information Report Management System, collected the notification rate of PTB from 2011 to 2022, patient datas (patient registration time and current address), administrative areas, and the relevant demographic information in Tianjin. To analyze the spatial-temporal distribution and clustering characteristic of PTB using SPSS 26.0, ArcGIS 10.7 and SaTScan 10.1 software. Results: Form 2011 to 2022, the notification rate of PTB in Tianjin ranged from 20.40/100000 (2801/13730000) to 26.42/100000 (3543/13410000), with no statistically significant difference ($x^{2}_{trend}=1.144$, P=0.233). The annual average notification rate of PTB were 23.82/100000 (39907/167506000) and the average annual decline rate was 2.32% $\left[\left(\sqrt[11]{\frac{20.40}{26.42}}-1\right) \times 100 \%\right]$. Form 2012 to 2016, the notification rate of PTB in Tianjin ranged from 23.15/100000 (3190/13780000) to 25.16/100000 (3548/14100000), with spatial aggregation (Moran’s I=0.138, 0.228, 0.130, 0.238, 0.288; Z=2.474, 3.625, 2.417, 3.732, 4.368; P=0.013, <0.001, 0.016, <0.001, <0.001). The local spatial autocorrelation analysis showed that there were two kinds of aggregation models (high-high and low-high models) in Tianjin except for 2021, in which clustering area were not formed. High-high clusters are mainly concentrated in the central urban area (Heping District, Hexi District, Hedong District, Nankai District, Hebei District, Hongqiao District) and the ring urban area (Beichen District, Dongli District, Xiqing District, and Jinnan District). The spatio-temporal scanning results showed that two spatio-temporal clustering areas existed. The first-level clustering area was mainly in six districts of Tianjin City from 2011-2016 (LLR=383.11, RR=1.42, P<0.001), and the second-level clustering area was in Binhai New Area from 2014-2019 (LLR=27.12, RR=1.32, P<0.001). Conclusion: The notification rate of PTB in Tianjin tends to be stable from 2011 to 2022 with spatial clustering from 2012 to 2016. The high-high clustering was mostly found in the central urban area and the ring urban area. And there were spatio-temporal clustering in the central urban areas and the Binhai New Area. As a consequence, we should pay attention to the changes of PTB epidemic in areas with large population mobility, dense population and economic development, to adjusted tuberculosis control strategy according to local conditions by improving the level of differential diagnosis and explored the strategy of active cases finding in the areas.

Key words: Tuberculosis, pulmonary, Space-time clustering, Epidemiologic studies, Data interpretation, statistical, Tianjin City

中图分类号: