| [1] |
LIU Xiao-li, LEI Li-mei, GUO Zhou-li, HUANG Yin, XU Jing, ZHAO Xia, WANG Yan, FU Li.
Study on the relationship of stigma and social support of tuberculosis patients
[J]. Chinese Journal of Antituberculosis, 2020, 42(9): 1002-1008.
|
| [2] |
Academic Working Committee of Chinese Antituberculosis Association, Editorial Board of Chinese Journal of Antituberculosis .
Expert consensus of clinical application of fixed-dose combination formulations
[J]. Chinese Journal of Antituberculosis, 2020, 42(9): 885-893.
|
| [3] |
JIN Hong-jian.
The construction of tuberculosis prevention and control service system at county level in China needs to be strengthened urgently —— Comments and suggestions of an old tuberculosis control and prevention worker
[J]. Chinese Journal of Antituberculosis, 2020, 42(9): 896-902.
|
| [4] |
ZHANG Can-you, XIA Hui, CHENG Jun.
Testing and reporting requirements for Class Ⅱ biosafety cabinet in tuberculosis laboratory
[J]. Chinese Journal of Antituberculosis, 2020, 42(9): 903-909.
|
| [5] |
ZHOU Lin, LIU Er-yong, MENG Qing-lin, CHEN Ming-ting, ZHOU Xin-hua, GAO Wei-wei, LIN Ming-gui, XIE Ru-ming.
Evaluation of the quality of pulmonary tuberculosis diagnosis after the implementation of the newly revised WS 288-2017 Diagnosis for pulmonary tuberculosis standards
[J]. Chinese Journal of Antituberculosis, 2020, 42(9): 910-915.
|
| [6] |
LIU Er-yong, WANG Qian, ZHOU Lin, ZHANG Guo-qin, ZHANG Xiu-lei, MA Yong-cheng, YANG Shu-min, WANG Cui, MENG Qing-lin, CHEN Ming-ting, LIN Ming-gui, TU De-hua..
Analysis of diagnostic quality of pulmonary tuberculosis with negative etiology in some areas of China
[J]. Chinese Journal of Antituberculosis, 2020, 42(9): 916-920.
|
| [7] |
MENG Qing-lin, LI Jin-lan, LIN Ding-wen, MA Yong-cheng, HOU Shuang-yi, LIU Nian-qiang, ZHOU Lin.
Analysis of the awareness about knowledge on the updated TB diagnosis standard among the practitioners in TB control institutions
[J]. Chinese Journal of Antituberculosis, 2020, 42(9): 921-925.
|
| [8] |
WANG Qian, ZHOU Lin, LIU Er-yong, ZHAO Yan-lin, LI Tao, CHEN Ming-ting, YANG Li-jia, WANG Jia..
A survey on the diagnostic ability of tuberculosis in the county-level medical institutions in China
[J]. Chinese Journal of Antituberculosis, 2020, 42(9): 926-930.
|
| [9] |
LI Ting, HE Jin-ge, SU Qian, LI Jing, LI Yun-kui, GAO Wen-feng, GAO Yuan, YANG Wen.
Value of tuberculin test in screening tuberculosis infection in HIV infected/AIDS patients in Butuo County, Sichuan Province
[J]. Chinese Journal of Antituberculosis, 2020, 42(9): 931-936.
|
| [10] |
LI Yun-kui, HE Jin-ge, SU Qian, LI Ting, LI Jing, GAO Wen-feng, YANG Wen, MAO Guang-yu.
Value of tuberculin test in screening tuberculosis infection in HIV infected/AIDS patients in Butuo County, Sichuan Province
[J]. Chinese Journal of Antituberculosis, 2020, 42(9): 937-941.
|
| [11] |
SU Qian, XIA Yong, LU Jia, WANG Dan-xia, HE Jin-ge.
Analysis on the epidemiological characteristics of pulmonary tuberculosis among children aged 0-14 in Sichuan Province from 2009 to 2018
[J]. Chinese Journal of Antituberculosis, 2020, 42(9): 942-947.
|
| [12] |
DENG Ya-li, ZHANG Tian-hua, LIU Wei-ping, ZHANG Hong-wei, MA Yu, LI Peng..
Temporal and spatial clustering analysis of pulmonary tuberculosis incidence in Shaanxi Province from 2014 to 2018
[J]. Chinese Journal of Antituberculosis, 2020, 42(9): 948-955.
|
| [13] |
DONG Xiao, ZHAO Zhen, LIU Nian-qiang, WANG Sen-lu, CUI Yan.
Analysis of the finding characteristics of pulmonary tuberculosis in the elderly population in Xinjiang Uygur Autonomous Region during 2009—2017
[J]. Chinese Journal of Antituberculosis, 2020, 42(9): 956-961.
|
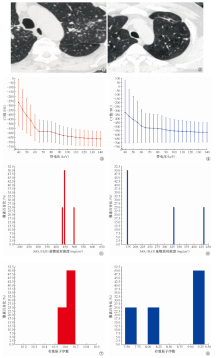
| [14] |
LIANG Rui-yun, FANG Wei-jun, REN Hui-li, LI Hui-ru, ZHANG Hui.
Study on CT manifestations of non-tuberculous mycobacterium pulmonary disease patients with and without diabetes mellitus
[J]. Chinese Journal of Antituberculosis, 2020, 42(9): 962-967.
|
| [15] |
MA Ting-long, HAN Yi, CHENG Xu, LIU Zhi-dong.
Clinical observation on treatment effectiveness of transdermal ultrasound-mediated drug delivery combined with oral anti-tuberculosis drug in patients with chest wall tuberculosis
[J]. Chinese Journal of Antituberculosis, 2020, 42(9): 968-972.
|

 )
)
 京公网安备11010202007215号
Total visitors: Visitors of today: Now online:
京公网安备11010202007215号
Total visitors: Visitors of today: Now online:
 This work is licensed under Creative Commons Attribution 3.0 License.