
Chinese Journal of Antituberculosis ›› 2019, Vol. 41 ›› Issue (4): 414-420.doi: 10.3969/j.issn.1000-6621.2019.04.009
• Original Articles • Previous Articles Next Articles
Ying CHEN,Huan-lu ZHENG,Juan YAO,Bai-yan LI,Hui GUO( )
)
Received:2018-10-27
Online:2019-04-10
Published:2019-04-08
Contact:
Hui GUO
E-mail:guohui9804@126.com
Ying CHEN,Huan-lu ZHENG,Juan YAO,Bai-yan LI,Hui GUO. Value of intravoxel incoherent motion diffusion weighted magnetic resonance imaging in diagnosis of spinal tuberculosis[J]. Chinese Journal of Antituberculosis, 2019, 41(4): 414-420. doi: 10.3969/j.issn.1000-6621.2019.04.009
Add to citation manager EndNote|Ris|BibTeX
URL: http://www.zgflzz.cn/EN/10.3969/j.issn.1000-6621.2019.04.009
| 序列 | TR(ms) | TE(ms) | 层厚(mm) | 层距(mm) | 层数 | FOV(mm) | 矩阵 |
|---|---|---|---|---|---|---|---|
| T1WI | 600 | 8 | 4 | 1 | 11 | 320×320 | 256×256 |
| T2WI | 6000 | 124 | 4 | 1 | 11 | 320×320 | 256×256 |
| FSE T2WI | 3200 | 83 | 4 | 1 | 11 | 320×320 | 256×256 |
| IVIM-DWI | 2290 | 53 | 3 | 1 | 15 | 320×320 | 256×256 |


| 组别 | 受累椎体个数 | f值(%, | D值(×10-3mm2/s, | D*值(×10-3mm2/s, |
|---|---|---|---|---|
| 病变椎体 | 19 | 12.91(8.15,22.73) | 0.88(0.73,1.40) | 39.99(20.15,66.35) |
| 跳跃2椎体 | 19 | 40.51(33.75,46.28) | 0.05(-0.20,0.15) | 27.51(16.07,37.49) |
| Z值 | 3.421 | 3.743 | 1.730 | |
| P值 | =0.001 | <0.001 | 0.084 |
| 项目 | 受累椎体个数 | f值(%, | D值(×10-3mm2/s, | D*值(×10-3mm2/s, |
|---|---|---|---|---|
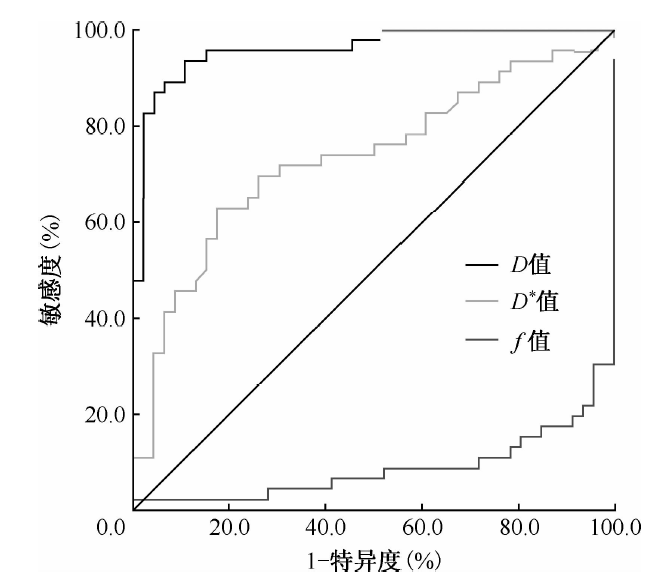
| 结核组病变椎体 | 46 | 12.91(8.15,22.73) | 0.88(0.73,1.40) | 39.99(20.15,66.35) |
| 对照组正常椎体 | 46 | 37.16(30.45,47.07) | 0.07(-0.12,0.28) | 20.37(12.26,29.97) |
| Z值 | 6.841 | 7.598 | 3.842 | |
| P值 | <0.001 | <0.001 | <0.001 |
| 组别 | 受累椎间盘个数 | f值(%, | D值(×10-3mm2/s, | D*值(×10-3mm2/s, |
|---|---|---|---|---|
| 病变椎间盘 | 37 | 6.72(4.36,11.53) | 2.06(1.92,2.26) | 56.46(24.83,98.35) |
| 正常椎间盘 | 37 | 5.72(3.00,7.85) | 1.88(1.79,1.85) | 61.59(16.46,123.00) |
| Z值 | 2.276 | 3.919 | 0.060 | |
| P值 | 0.023 | <0.001 | 0.953 |

| [1] |
Yang B, Hu H, Chen J , et al. The evaluation of the clinical, laboratory, and radiological findings of 16 cases of brucellar spondylitis. Biomed Res Int, 2016,2016:8903635.
doi: 10.1155/2016/8903635 URL pmid: 5031813 |
| [2] | 赵林伟, 董国礼, 董嘉懿 , 等. 脊柱结核和恶性肿瘤弥散加权成像中感兴趣区设置方法初探. 生物医学工程学杂志, 2012,29(1):55-58. |
| [3] |
Lebre A, Velez J, Seixas D , et al. Brucellar spondylodiscitis: case series of the last 25 years. Acta Med Port, 2014,27(2):204-210.
doi: 10.20344/amp.4117 URL |
| [4] |
Yiping L, Kawai S, Jianbo W , et al. Evaluation parameters between intra-voxel incoherent motion and diffusion-weighted imaging in grading and differentiating histological subtypes of meningioma: A prospective pilot study. J Neurol Sci, 2017,372:60-69.
doi: 10.1016/j.jns.2016.11.037 URL pmid: 28017250 |
| [5] |
Liu C, Liang C, Liu Z , et al. Intravoxel incoherent motion (IVIM) in evaluation of breast lesions: comparison with conventional DWI. Eur J Radiol, 2013,82(12):e782-789.
doi: 10.1016/j.ejrad.2013.08.006 URL pmid: 24034833 |
| [6] |
Vargas HA, Lawrence EM, Mazaheri Y , et al. Updates in advanced diffusion-weighted magnetic resonance imaging techniques in the evaluation of prostate cancer. World J Radiol, 2015,7(8):184-188.
doi: 10.4329/wjr.v7.i8.184 URL pmid: 4553248 |
| [7] |
Sigmund EE, Cho GY, Kim S , et al. Intravoxel incoherent motion imaging of tumor microenvironment in locally advanced breast cancer. Magn reson Med, 2011,65(5):1437-1447.
doi: 10.1002/mrm.22740 URL pmid: 21287591 |
| [8] | 邹明珠, 宋焱, 朱捷 , 等. 基于体素不相干运动的多b值MR扩散加权成像评估椎体骨髓生理变化的初步研究. 医学影像学杂志, 2018,28(3):468-472. |
| [9] |
丁爽, 赵之颢, 杨利霞 , 等. 磁共振扩散加权成像在脊椎结核病中的应用. 中国CT和MRI杂志, 2010,8(5):12-14.
doi: 10.3969/j.issn.1672-5131.2010.05.004 URL |
| [10] |
Dixon WT . Separation of diffusion and perfusion in intravoxel incoherent motion MR imaging:a modest proposal with tremendous potential. Radiology, 1988,168(2):566-567.
doi: 10.1148/radiology.168.2.3393682 URL pmid: 3393682 |
| [11] |
Gurney-Champion OJ, Klaassen R, Froeling M , et al. Comparison of six fit algorithms for the intra-voxel incoherent motion model of diffusion-weighted magnetic resonance imaging data of pancreatic cancer patients. PLoS One, 2018,13(4):e0194590.
doi: 10.1371/journal.pone.0194590 URL |
| [12] |
Iima M, Le Bihan D . Clinical intravoxel incoherent motion and diffusion MR imaging: past, present, and future. Radiology, 2016,278(1):13-32.
doi: 10.1148/radiol.2015150244 URL pmid: 26690990 |
| [13] |
Zhang H, Lu Z . Atypical imaging of spinal tuberculosis: a case report and review of literature. Pan Afr Med J, 2016,24:101.
doi: 10.11604/pamj.2016.24.101.9701 URL pmid: 27642440 |
| [14] |
班超, 葛丽红, 牛广明 , 等. 强直性脊柱炎骶髂关节病变磁共振成像定量研究进展. 磁共振成像, 2018,9(2):157-160.
doi: 10.12015/issn.1674-8034.2018.02.016 URL |
| [15] |
武小鹏, 高阳, 吴慧 , 等. IVIM在不是杆菌性脊柱炎、脊柱结核和脊柱转移瘤鉴别诊断中的价值. 临床放射学杂志, 2018,37(5):828-832.
doi: 10.3760/cma.j.issn.1005?1201.2017.03.009 URL |
| [16] |
张水兴, 贾乾君, 张忠平 , 等. 基于体素内不相干运动的扩散加权成像对鼻咽癌与炎性增生性疾病的鉴别诊断. 中华放射学杂志, 2013,47(7):617-621.
doi: 10.3760/cma.j.issn.1005-1201.2013.07.009 URL |
| [17] | 龚彤 . 正常骨髓及AL骨髓浸润的IVIM初步研究. 太原:山西医科大学, 2016. |
| [18] |
Sakamoto J, Imaizumi A, Sasaki Y , et al. Comparison of accuracy of intravoxel incoherent motion and apparent diffusion coefficient techniques for predicting malignancy of head and neck tumors using half-Fourier single-shot turbo spin-echo diffusion-weighted imaging. Magn Reson Imaging, 2014,32(7):860-866.
doi: 10.1016/j.mri.2014.05.002 URL pmid: 24832359 |
| [19] |
Pang Y, Turkbey B, Bernardo M , et al. Intravoxel incoherent motion MR imaging for prostate cancer: an evaluation of perfusion fraction and diffusion coefficient derived from different b-value combinations. Magn Reson Med, 2013,69(2):553-562.
doi: 10.1002/mrm.24277 URL pmid: 22488794 |
| [20] |
Guiu B, Petit JM, Capitan V , et al. Intravoxel incoherent motion diffusion-weighted imaging in nonalcoholic fatty liver disease: a 3.0-T MR study. Radiology, 2012,265(1):96-103.
doi: 10.1148/radiol.12112478 URL pmid: 22843768 |
| [21] |
陈雪雯, 应捷飞, 杨阳 , 等. 无症状大学生腰椎间盘MRI信号变化及其临床意义. 磁共振成像, 2013,4(2):121-124.
doi: 10.3969/j.issn.1674-8034.2013.02.009 URL |
| [1] | LIU Xiao-li, LEI Li-mei, GUO Zhou-li, HUANG Yin, XU Jing, ZHAO Xia, WANG Yan, FU Li. Study on the relationship of stigma and social support of tuberculosis patients [J]. Chinese Journal of Antituberculosis, 2020, 42(9): 1002-1008. |
| [2] | Academic Working Committee of Chinese Antituberculosis Association, Editorial Board of Chinese Journal of Antituberculosis . Expert consensus of clinical application of fixed-dose combination formulations [J]. Chinese Journal of Antituberculosis, 2020, 42(9): 885-893. |
| [3] | JIN Hong-jian. The construction of tuberculosis prevention and control service system at county level in China needs to be strengthened urgently —— Comments and suggestions of an old tuberculosis control and prevention worker [J]. Chinese Journal of Antituberculosis, 2020, 42(9): 896-902. |
| [4] | ZHANG Can-you, XIA Hui, CHENG Jun. Testing and reporting requirements for Class Ⅱ biosafety cabinet in tuberculosis laboratory [J]. Chinese Journal of Antituberculosis, 2020, 42(9): 903-909. |
| [5] | ZHOU Lin, LIU Er-yong, MENG Qing-lin, CHEN Ming-ting, ZHOU Xin-hua, GAO Wei-wei, LIN Ming-gui, XIE Ru-ming. Evaluation of the quality of pulmonary tuberculosis diagnosis after the implementation of the newly revised WS 288-2017 Diagnosis for pulmonary tuberculosis standards [J]. Chinese Journal of Antituberculosis, 2020, 42(9): 910-915. |
| [6] | LIU Er-yong, WANG Qian, ZHOU Lin, ZHANG Guo-qin, ZHANG Xiu-lei, MA Yong-cheng, YANG Shu-min, WANG Cui, MENG Qing-lin, CHEN Ming-ting, LIN Ming-gui, TU De-hua.. Analysis of diagnostic quality of pulmonary tuberculosis with negative etiology in some areas of China [J]. Chinese Journal of Antituberculosis, 2020, 42(9): 916-920. |
| [7] | MENG Qing-lin, LI Jin-lan, LIN Ding-wen, MA Yong-cheng, HOU Shuang-yi, LIU Nian-qiang, ZHOU Lin. Analysis of the awareness about knowledge on the updated TB diagnosis standard among the practitioners in TB control institutions [J]. Chinese Journal of Antituberculosis, 2020, 42(9): 921-925. |
| [8] | WANG Qian, ZHOU Lin, LIU Er-yong, ZHAO Yan-lin, LI Tao, CHEN Ming-ting, YANG Li-jia, WANG Jia.. A survey on the diagnostic ability of tuberculosis in the county-level medical institutions in China [J]. Chinese Journal of Antituberculosis, 2020, 42(9): 926-930. |
| [9] | LI Ting, HE Jin-ge, SU Qian, LI Jing, LI Yun-kui, GAO Wen-feng, GAO Yuan, YANG Wen. Value of tuberculin test in screening tuberculosis infection in HIV infected/AIDS patients in Butuo County, Sichuan Province [J]. Chinese Journal of Antituberculosis, 2020, 42(9): 931-936. |
| [10] | LI Yun-kui, HE Jin-ge, SU Qian, LI Ting, LI Jing, GAO Wen-feng, YANG Wen, MAO Guang-yu. Value of tuberculin test in screening tuberculosis infection in HIV infected/AIDS patients in Butuo County, Sichuan Province [J]. Chinese Journal of Antituberculosis, 2020, 42(9): 937-941. |
| [11] | SU Qian, XIA Yong, LU Jia, WANG Dan-xia, HE Jin-ge. Analysis on the epidemiological characteristics of pulmonary tuberculosis among children aged 0-14 in Sichuan Province from 2009 to 2018 [J]. Chinese Journal of Antituberculosis, 2020, 42(9): 942-947. |
| [12] | DENG Ya-li, ZHANG Tian-hua, LIU Wei-ping, ZHANG Hong-wei, MA Yu, LI Peng.. Temporal and spatial clustering analysis of pulmonary tuberculosis incidence in Shaanxi Province from 2014 to 2018 [J]. Chinese Journal of Antituberculosis, 2020, 42(9): 948-955. |
| [13] | DONG Xiao, ZHAO Zhen, LIU Nian-qiang, WANG Sen-lu, CUI Yan. Analysis of the finding characteristics of pulmonary tuberculosis in the elderly population in Xinjiang Uygur Autonomous Region during 2009—2017 [J]. Chinese Journal of Antituberculosis, 2020, 42(9): 956-961. |
| [14] | LIANG Rui-yun, FANG Wei-jun, REN Hui-li, LI Hui-ru, ZHANG Hui. Study on CT manifestations of non-tuberculous mycobacterium pulmonary disease patients with and without diabetes mellitus [J]. Chinese Journal of Antituberculosis, 2020, 42(9): 962-967. |
| [15] | MA Ting-long, HAN Yi, CHENG Xu, LIU Zhi-dong. Clinical observation on treatment effectiveness of transdermal ultrasound-mediated drug delivery combined with oral anti-tuberculosis drug in patients with chest wall tuberculosis [J]. Chinese Journal of Antituberculosis, 2020, 42(9): 968-972. |
| Viewed | ||||||
|
Full text |
|
|||||
|
Abstract |
|
|||||
 京公网安备11010202007215号
Total visitors: Visitors of today: Now online:
京公网安备11010202007215号
Total visitors: Visitors of today: Now online:
 This work is licensed under Creative Commons Attribution 3.0 License.