
Chinese Journal of Antituberculosis ›› 2018, Vol. 40 ›› Issue (10): 1089-1094.doi: 10.3969/j.issn.1000-6621.2018.10.012
• Editorial • Previous Articles Next Articles
Jian-mei WANG1,Yu ZHANG2,Nan QIN1,Yue WANG1,Lin ZHOU2,†( ),Wei-bing WANG1,†()
Received:2018-06-03
Online:2018-10-10
Published:2018-10-18
Contact:
Lin ZHOU,Wei-bing WANG
E-mail:lzhou@cdc.zj.cn;wwb@fudan.edu.cn
Jian-mei WANG,Yu ZHANG,Nan QIN,Yue WANG,Lin ZHOU,Wei-bing WANG. Spatial analysis on smear-positive pulmonary tuberculosis in Zhejiang province between year 2015 and 2017[J]. Chinese Journal of Antituberculosis, 2018, 40(10): 1089-1094. doi: 10.3969/j.issn.1000-6621.2018.10.012
Add to citation manager EndNote|Ris|BibTeX
URL: http://www.zgflzz.cn/EN/10.3969/j.issn.1000-6621.2018.10.012
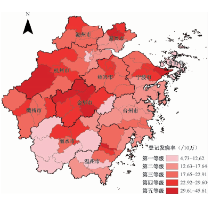
| 地级市 | 2015年 | 2016年 | 2017年 | ||||||
|---|---|---|---|---|---|---|---|---|---|
| 人口数 (万) | 涂阳患者 例数 | 登记发病率 (/10万) | 人口数 (万) | 涂阳患者 例数 | 登记发病率 (/10万) | 人口数 (万) | 涂阳患者 例数 | 登记发病率 (/10万) | |
| 杭州市 | 715.8 | 1 581 | 22.09 | 723.6 | 1 351 | 18.67 | 736.0 | 1 389 | 18.87 |
| 湖州市 | 263.8 | 606 | 22.97 | 263.7 | 556 | 21.08 | 264.8 | 510 | 19.26 |
| 嘉兴市 | 348.1 | 783 | 22.49 | 349.5 | 801 | 22.92 | 352.1 | 702 | 19.94 |
| 金华市 | 475.1 | 1 570 | 33.05 | 478.1 | 1 460 | 30.54 | 481.2 | 1 430 | 29.72 |
| 丽水市 | 265.7 | 401 | 15.09 | 266.4 | 450 | 16.89 | 268.0 | 461 | 17.20 |
| 宁波市 | 583.8 | 1 317 | 22.56 | 586.6 | 1 284 | 21.89 | 591.0 | 1 345 | 22.76 |
| 衢州市 | 255.7 | 598 | 23.39 | 256.4 | 568 | 22.15 | 257.5 | 591 | 22.95 |
| 绍兴市 | 443.0 | 928 | 20.95 | 443.1 | 919 | 20.74 | 444.5 | 922 | 20.74 |
| 台州市 | 597.1 | 1 033 | 17.30 | 597.5 | 945 | 15.82 | 600.2 | 1 064 | 17.73 |
| 温州市 | 813.7 | 1 658 | 20.38 | 811.2 | 1 393 | 17.17 | 818.2 | 1 394 | 17.04 |
| 舟山市 | 97.5 | 119 | 12.21 | 97.4 | 93 | 9.55 | 97.3 | 70 | 7.19 |
| 合计 | 4 859.2 | 10 594 | 21.80 | 4 873.3 | 9 820 | 20.15 | 4 910.8 | 9 878 | 20.11 |

| 年份 | 涂阳肺结核登记情况 | ||
|---|---|---|---|
| Moran’s I指数 | Z值 | P值 | |
| 2015 | 0.387 | 5.299 | <0.001 |
| 2016 | 0.376 | 5.063 | <0.001 |
| 2017 | 0.412 | 5.532 | <0.001 |
| 年均 | 0.429 | 5.834 | <0.001 |
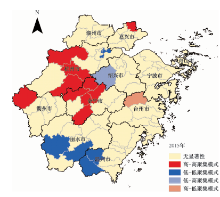
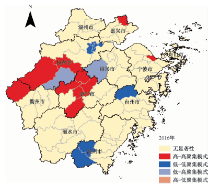
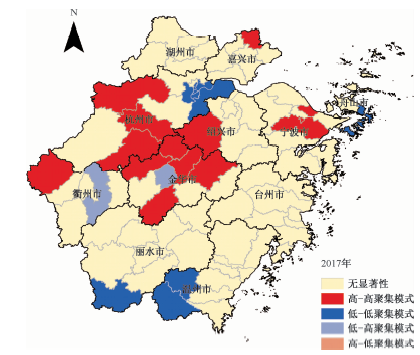
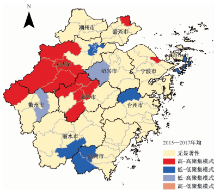
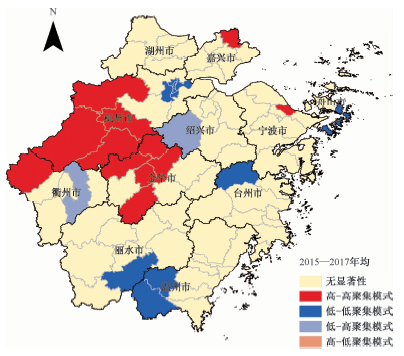
| 聚集模式 | 浙江省各县(市、区) |
|---|---|
| 高-高聚集模式 | 武义县、金东区、兰溪市、开化县、义乌市、浦江县、建德市、淳安县、桐庐县、镇海区、临安市、嘉善县 |
| 低-低聚集模式 | 泰顺县、文成县、天台县、滨江区、上城区、下城区、西湖区、江干区、拱墅区、普陀区、景宁畲族县 |
| 低-高聚集模式 | 衢江区、诸暨市 |
| 高-低聚集模式 | 无 |


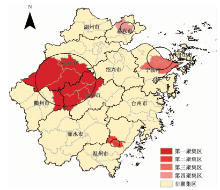
| 聚集 区域 | 县(市、区) | 时间 (年) | 登记 患者例数 | 预计 患者例数 | RR值 | LLR值 | P值 |
|---|---|---|---|---|---|---|---|
| 第一 | 婺城区、龙游县、金东区、兰溪市、义乌市、浦江县、建德市、淳安县、桐庐县 | 2015 | 1 626 | 942 | 1.77 | 211.54 | <0.001 |
| 第二 | 鹿城区、瓯海区 | 2015 | 427 | 243 | 1.77 | 57.66 | <0.001 |
| 第三 | 海曙区、鄞州区、北仑区、江北区、镇海区 | 2017 | 725 | 486 | 1.50 | 51.70 | <0.001 |
| 第四 | 秀洲区、南湖区 | 2016 | 321 | 181 | 1.78 | 44.47 | <0.001 |

| [1] | 全国第五次结核病流行病学抽样调查技术指导组, 全国第五次结核病流行病学抽样调查办公室. 2010年全国第五次结核病流行病学抽样调查报告. 中国防痨杂志, 2012,34(8):485-508. |
| [2] |
李新旭, 周晓农, 王黎霞 . 结核病空间分布特征及影响因素研究进展. 中国公共卫生, 2014,30(1):102-106.
doi: 10.11847/zgggws2014-30-01-31 URL |
| [3] |
Ge E, Zhang X, Wang X , et al. Spatial and temporal analysis of tuberculosis in Zhejiang Province, China, 2009—2012. Infect Dis Poverty, 2016,5:11.
doi: 10.1186/s40249-016-0104-2 URL pmid: 26906041 |
| [4] |
陈文明, 王晓萌, 陈彬 , 等. 浙江省2010—2012年耐多药结核病患者空间分布特征分析. 中华流行病学杂志, 2016,37(6):831-835.
doi: 10.3760/cma.j.issn.0254-6450.2016.06.018 URL |
| [5] |
单志力, 徐刚, 周祖木 , 等. 2008—2013年温州市肺结核疫情时空流行病学分析. 中国防痨杂志, 2016,38(2):99-103.
doi: 10.3969/j.issn.1000-6621.2016.02.006 URL |
| [6] |
陈文明, 张钰, 周琳 , 等. 浙江省2005年至2014年结核病登记的空间扫描研究. 中华传染病杂志, 2017,35(2):88-92.
doi: 10.3760/cma.j.issn.1000-6680.2017.02.006 URL |
| [7] |
Krieger N . Place, space, and health: GIS and epidemiology. Epidemiology, 2003,14(4):384-385.
doi: 10.1097/01.ede.0000071473.69307.8a URL pmid: 12843759 |
| [8] | Zhao F, Cheng S, He G , et al. Space-time clustering charateris-tics of tuberculosis in China,2005-2011. PLoS One, 2013,8(12):e83605. |
| [9] |
黄飞, 成诗明, 杜昕 , 等. 中国2003—2008年新涂阳肺结核登记的空间分析. 中华流行病学杂志, 2010,31(11):1276-1279.
doi: 10.3760/cma.j.issn.0254-6450.2010.11.017 URL |
| [10] | 刘云霞, 李士雪, 王忠东 , 等. 基于时空重排扫描统计量的结核病聚集性研究. 山东大学学报(医学版), 2009,47(12):122-125. |
| [11] | 唐益, 龚德华, 白丽琼 , 等. 湖南省2003—2011年活动性肺结核患者登记的空间分析. 中国防痨杂志, 2012,34(12):764-767. |
| [12] | Stelling J, Yih WK, Galas M , et al. Automated use of WHONET and SaTScan to detect outbreaks of Shigella spp. using antimicrobial resistance phenotypes. Epidemiol Infect, 2010,138(6):873-883. |
| [13] | World Health Organization. The End TB Strategy—Global strategy and targets for tuberculosis prevention, care and control after 2015(EB/OL).(2014-05-19) [2018-07-21] . |
| [14] |
张玉, 叶建君, 黄飞 , 等. 2011—2016年湖北省肺结核发病的时空聚集性分析. 中国防痨杂志, 2017,39(9):1001-1009.
doi: 10.3969/j.issn.1000-6621.2017.09.020 URL |
| [15] |
黄茹, 李鑫尧, 肖洪 , 等. 空间统计分析方法在结核病研究中的应用. 中国防痨杂志, 2016,38(6):432-435.
doi: 10.3969/j.issn.1000-6621.2016.06.003 URL |
| [16] |
李婷, 何金戈, 杨长虹 , 等. 基于空间聚集性与时空扫描的肺结核流行特征分析. 中国防痨杂志, 2016,38(12):1032-1040.
doi: 10.3969/j.issn.1000-6621.2016.12.007 URL |
| [17] |
Li T, He XX, Chang ZR , et al. Impact of new migrant populations on the spatial distribution of tuberculosis in Beijing. Int J Tuberc Lung Dis, 2011,15(2):163-168.
doi: 10.1111/j.1469-0691.2010.03283.x URL pmid: 21219675 |
| [18] | Wei X, Chen J, Chen P , et al. Barriers to TB care for rural-to-urban migrant TB patients in Shanghai: a qualitative study. Trop Med Int Health, 2010,14(7):754-760. |
| [19] |
Chen J, Qi L, Xia Z , et al. Which urban migrants default from tuberculosis treatment in Shanghai, China? PLoS One, 2013,8(11):e81351.
doi: 10.1371/journal.pone.0081351 URL pmid: 3842957 |
| [20] | 丁磊, 张萌, 赵仲堂 . 空间分析在自然疫源性疾病流行病学研究中的应用. 中华疾病控制杂志, 2012,16(10):897-901. |
| [21] |
高杰, 张志杰, 王增亮 , 等. 2008—2010年山东省居民饮用水碘空间分布特征分析. 中华预防医学杂志, 2013,47(1):18-22.
doi: 10.3760/cma.j.issn.0253-9624.2013.01.005 URL |
| [22] |
夏愔愔, 成君, 张慧 , 等. 2010年全国不同人群和地区新涂阳肺结核登记率与患病率比值分析. 中国防痨杂志, 2014,36(6):498-502.
doi: 10.3969/j.issn.1000-6621.2014.06.018 URL |
| [1] | LIU Xiao-li, LEI Li-mei, GUO Zhou-li, HUANG Yin, XU Jing, ZHAO Xia, WANG Yan, FU Li. Study on the relationship of stigma and social support of tuberculosis patients [J]. Chinese Journal of Antituberculosis, 2020, 42(9): 1002-1008. |
| [2] | Academic Working Committee of Chinese Antituberculosis Association, Editorial Board of Chinese Journal of Antituberculosis . Expert consensus of clinical application of fixed-dose combination formulations [J]. Chinese Journal of Antituberculosis, 2020, 42(9): 885-893. |
| [3] | JIN Hong-jian. The construction of tuberculosis prevention and control service system at county level in China needs to be strengthened urgently —— Comments and suggestions of an old tuberculosis control and prevention worker [J]. Chinese Journal of Antituberculosis, 2020, 42(9): 896-902. |
| [4] | ZHANG Can-you, XIA Hui, CHENG Jun. Testing and reporting requirements for Class Ⅱ biosafety cabinet in tuberculosis laboratory [J]. Chinese Journal of Antituberculosis, 2020, 42(9): 903-909. |
| [5] | ZHOU Lin, LIU Er-yong, MENG Qing-lin, CHEN Ming-ting, ZHOU Xin-hua, GAO Wei-wei, LIN Ming-gui, XIE Ru-ming. Evaluation of the quality of pulmonary tuberculosis diagnosis after the implementation of the newly revised WS 288-2017 Diagnosis for pulmonary tuberculosis standards [J]. Chinese Journal of Antituberculosis, 2020, 42(9): 910-915. |
| [6] | LIU Er-yong, WANG Qian, ZHOU Lin, ZHANG Guo-qin, ZHANG Xiu-lei, MA Yong-cheng, YANG Shu-min, WANG Cui, MENG Qing-lin, CHEN Ming-ting, LIN Ming-gui, TU De-hua.. Analysis of diagnostic quality of pulmonary tuberculosis with negative etiology in some areas of China [J]. Chinese Journal of Antituberculosis, 2020, 42(9): 916-920. |
| [7] | MENG Qing-lin, LI Jin-lan, LIN Ding-wen, MA Yong-cheng, HOU Shuang-yi, LIU Nian-qiang, ZHOU Lin. Analysis of the awareness about knowledge on the updated TB diagnosis standard among the practitioners in TB control institutions [J]. Chinese Journal of Antituberculosis, 2020, 42(9): 921-925. |
| [8] | WANG Qian, ZHOU Lin, LIU Er-yong, ZHAO Yan-lin, LI Tao, CHEN Ming-ting, YANG Li-jia, WANG Jia.. A survey on the diagnostic ability of tuberculosis in the county-level medical institutions in China [J]. Chinese Journal of Antituberculosis, 2020, 42(9): 926-930. |
| [9] | LI Ting, HE Jin-ge, SU Qian, LI Jing, LI Yun-kui, GAO Wen-feng, GAO Yuan, YANG Wen. Value of tuberculin test in screening tuberculosis infection in HIV infected/AIDS patients in Butuo County, Sichuan Province [J]. Chinese Journal of Antituberculosis, 2020, 42(9): 931-936. |
| [10] | LI Yun-kui, HE Jin-ge, SU Qian, LI Ting, LI Jing, GAO Wen-feng, YANG Wen, MAO Guang-yu. Value of tuberculin test in screening tuberculosis infection in HIV infected/AIDS patients in Butuo County, Sichuan Province [J]. Chinese Journal of Antituberculosis, 2020, 42(9): 937-941. |
| [11] | SU Qian, XIA Yong, LU Jia, WANG Dan-xia, HE Jin-ge. Analysis on the epidemiological characteristics of pulmonary tuberculosis among children aged 0-14 in Sichuan Province from 2009 to 2018 [J]. Chinese Journal of Antituberculosis, 2020, 42(9): 942-947. |
| [12] | DENG Ya-li, ZHANG Tian-hua, LIU Wei-ping, ZHANG Hong-wei, MA Yu, LI Peng.. Temporal and spatial clustering analysis of pulmonary tuberculosis incidence in Shaanxi Province from 2014 to 2018 [J]. Chinese Journal of Antituberculosis, 2020, 42(9): 948-955. |
| [13] | DONG Xiao, ZHAO Zhen, LIU Nian-qiang, WANG Sen-lu, CUI Yan. Analysis of the finding characteristics of pulmonary tuberculosis in the elderly population in Xinjiang Uygur Autonomous Region during 2009—2017 [J]. Chinese Journal of Antituberculosis, 2020, 42(9): 956-961. |
| [14] | MA Ting-long, HAN Yi, CHENG Xu, LIU Zhi-dong. Clinical observation on treatment effectiveness of transdermal ultrasound-mediated drug delivery combined with oral anti-tuberculosis drug in patients with chest wall tuberculosis [J]. Chinese Journal of Antituberculosis, 2020, 42(9): 968-972. |
| [15] | NAN Hai, ZHANG Yun, YANG Xin-ting, DUAN Hong-fei. Meta-analysis on the diagnostic value of GeneXpert MTB/RIF for bone and joint tuberculosis [J]. Chinese Journal of Antituberculosis, 2020, 42(9): 973-980. |
| Viewed | ||||||
|
Full text |
|
|||||
|
Abstract |
|
|||||
 京公网安备11010202007215号
Total visitors: Visitors of today: Now online:
京公网安备11010202007215号
Total visitors: Visitors of today: Now online:
 This work is licensed under Creative Commons Attribution 3.0 License.