Email Alert | RSS    帮助

中国防痨杂志 ›› 2020, Vol. 42 ›› Issue (9): 948-955.doi: 10.3969/j.issn.1000-6621.2020.09.012

• 论著 • 上一篇    下一篇

2014—2018年陕西省肺结核发病的时空聚集性分析

邓亚丽, 张天华, 刘卫平, 张宏伟, 马煜(), 李鹏   

  1. 710048 西安,陕西省结核病防治研究所(邓亚丽、张天华、刘卫平、张宏伟、马煜);西安交通大学医学部公共卫生学院流行病与卫生统计学教研室(李鹏)
  • 收稿日期:2020-03-18 出版日期:2020-09-10 发布日期:2020-09-18
  • 通信作者: 马煜 E-mail:mayufzhk@126.com
  • 基金资助:
    陕西省卫生科研基金(2018D044)

Temporal and spatial clustering analysis of pulmonary tuberculosis incidence in Shaanxi Province from 2014 to 2018

DENG Ya-li, ZHANG Tian-hua, LIU Wei-ping, ZHANG Hong-wei, MA Yu(), LI Peng.   

  1. Shaanxi Provincial Institute for Tuberculosis Control and Prevention, Xi’an 710048, China
  • Received:2020-03-18 Online:2020-09-10 Published:2020-09-18
  • Contact: MA Yu E-mail:mayufzhk@126.com

摘要:

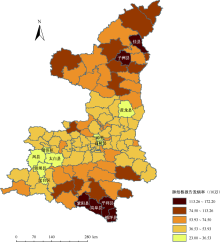
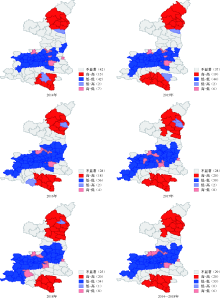
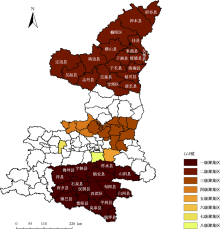
目的 对陕西省2014—2018年肺结核发病的时空聚集特征进行分析,为制定防控策略和措施提供科学依据。 方法 通过ArcGIS 10.7软件构建以县(区)为单位,包括地区编码、经度、纬度、人口和发病数量的地理信息数据库。2014—2018年陕西省常住人口数分别为3764.00万、3775.12万、3792.87万、3797.77万、3883.48万名,肺结核报告发病数分别为21596例、21388例、21355例、22517例、21442例。利用GeoDa 1.14.0和SaTScan 9.6软件进行肺结核发病的空间和时空聚集性分析,采用ArcGIS 10.7软件实现地理数据的处理和聚集性地区的显示。 结果 2014—2018年陕西省肺结核发病呈明显的空间聚集性,莫兰指数(Moran I)分别为0.362、0.516、0.597、0.562、0.484,Z值分别为8.202、11.441、13.404、12.850、10.843,P值均为0.001。2014—2018年发病的“高-高”地区分别有15个、19个、18个、20个、20个,主要分布在陕西省的陕北和陕南地区,特别是榆林市和安康市。2014—2018年肺结核分月发病率时空聚集性分析显示,一级聚集区分布在安康市及与其接壤的汉中市和商洛市的5个县(区);二级聚集区分布在榆林市及与其接壤的延安市的7个县(区)。除2015年一级聚集区的聚集时间出现在9~11月,其余年度聚集时间均出现在1~4月。 结论 陕西省肺结核发病具有明显的时空聚集性,聚集时间为每年的春季,聚集区域主要分布在榆林市和安康市,应将其作为防控的重点地区。

关键词: 结核,肺, 时空聚类分析, 流行病学研究特征(主题), 陕西省

Abstract:

Objective To analyze the distribution characters of space-time specific incidence of pulmonary tuberculosis (PTB) in Shaanxi Province and to provide scientific basis for strategies and measures development on TB control and prevention. Methods ArcGIS 10.7 software was used to create a geographic information database with counties (districts) as the unit, including regional code, longitude, latitude, population and incidence number. Numbers of permanent residents in Shaanxi were 37.64 million, 37.75 million, 37.93 million, 37.98 million and 38.83 million respectively from 2014 to 2018. There were 21596 cases, 21388 cases, 21355 cases, 22517 cases and 21442 cases reported in Shaanxi Province from 2014 to 2018. GeoDa 1.14.0 and SaTScan 9.6 were used for spatial and temporal aggregation analysis of tuberculosis incidence, and ArcGIS 10.7 software was used for geographic data processing and aggregation area display. Results The incidence of PTB in Shaanxi showed significant space clusters from 2014 to 2018. The Moran I index was 0.362, 0.516, 0.597, 0.562 and 0.484 respectively, and the Z value was 8.202, 11.441, 13.404, 12.850 and 10.843 respectively, all of the P values were 0.001. From 2014 to 2018, there were 15, 19, 18, 20 and 20 counties in “high-high” region, which were mainly in the north and south of Shaanxi, especially in Yulin and Ankang. By space-time analysis, the first level cluster was distributed in Ankang and 5 counties of bordering city. The second level cluster was mainly distributed in Yulin and 7 counties of Yan’an. Except for September to November of 2015, the first level clustering time was from January to April of each year. Conclusion The incidence of PTB has obvious space-time clustering in Shaanxi Province. The clustering time is in spring, and the clustering areas are mainly distributed in Yulin and Ankang city, which should be regarded as the key area for prevention and control.

Key words: Tuberculosis,pulmonary, Space-time clustering, Epidemiologic study characteristics as topic, Shaanxi province