Email Alert | RSS    帮助

中国防痨杂志 ›› 2020, Vol. 42 ›› Issue (9): 962-967.doi: 10.3969/j.issn.1000-6621.2020.09.014

• 论著 • 上一篇    下一篇

非结核分枝杆菌肺病并发与未并发糖尿病患者的CT征象研究

梁瑞云, 方伟军(), 任会丽, 黎惠如, 张晖   

  1. 510095 广州市胸科医院放射科
  • 收稿日期:2020-02-17 出版日期:2020-09-10 发布日期:2020-09-18
  • 通信作者: 方伟军 E-mail:fangweijun9@sohu.com
  • 基金资助:
    广州市高水平临床重点专科和培育专科建设项目(穗卫函〔2019〕1555号);广东省转化医学创新平台培育建设项目B类(粤卫函〔2018〕1254号)

Study on CT manifestations of non-tuberculous mycobacterium pulmonary disease patients with and without diabetes mellitus

LIANG Rui-yun, FANG Wei-jun(), REN Hui-li, LI Hui-ru, ZHANG Hui   

  1. Department of Radiology,Guangzhou Chest Hospital,Guangzhou 510095,China
  • Received:2020-02-17 Online:2020-09-10 Published:2020-09-18
  • Contact: FANG Wei-jun E-mail:fangweijun9@sohu.com

摘要:

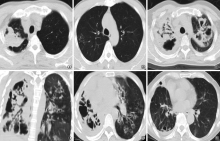
目的 探讨非结核分枝杆菌肺病并发与未并发糖尿病患者CT征象的差异,以期提高对两种疾病的鉴别诊断水平。方法 收集2018年1—12月广州市胸科医院收治的经临床与实验室确诊为非结核分枝杆菌肺病并发糖尿病患者59例(A组)和非结核分枝杆菌肺病未并发糖尿病患者59例(B组)的CT检查资料,比较两组患者CT扫描显示的病灶分布及征象。采用SPSS 21.0软件进行统计学分析。计数资料采用χ2检验或连续校正χ2检验进行比较,均以P<0.05为差异有统计学意义。结果 (1)病灶分布:A组病灶分布≥3叶的显示率(83.05%,49/59)明显高于B组(66.10%,39/59),差异有统计学意义(χ2=4.470,P=0.035)。(2)CT扫描征象:B组结节状病灶、树芽征的显示率分别为88.14%(52/59)、71.19%(42/59),均明显高于A组[分别为67.80%(40/59)、52.54%(31/59)],差异均有统计学意义(χ2值分别为7.104、4.346,P值分别为0.008、0.037);A组实变影、空洞、球状/团块状影、蜂窝状影的显示率分别为35.59%(21/59)、67.80%(40/59)、38.98%(23/59)、25.42%(15/59),均明显高于B组[分别为13.56%(8/59)、49.15%(29/59)、11.86%(7/59)、3.39%(2/59)],差异均有统计学意义(χ2值分别为7.726、4.223、8.139、11.614,P值分别为0.005、0.040、0.004、0.001)。(3)空洞:A组厚壁空洞显示率(55.93%,33/59)高于B组(20.34%,12/59),B组薄壁空洞显示率(38.98%,23/59)高于A组(22.03%,13/59),差异均有统计学意义(χ2值分别为15.841、3.997,P值分别为0.000、0.046)。A组空洞分布≥3叶、数量≥3个者分别占59.32%(35/59)、57.63%(34/59),均明显高于B组[分别为28.81%(17/59)、35.59%(21/59)],差异均有统计学意义(χ2值分别为11.140、5.755,P值分别为0.001、0.016)。结论 非结核分枝杆菌肺病并发糖尿病患者胸部CT扫描更易看到病灶分布范围广、实变影、厚壁空洞、球状/团块状影、蜂窝状影;非结核分枝杆菌肺病未并发糖尿病患者更易看到薄壁空洞、结节状病灶、树芽征;以上CT征象有助于对两种疾病的鉴别。

关键词: 肺疾病, 分枝杆菌感染,非典型性, 糖尿病, 共病现象, 诊断显像, 对比研究, 诊断,鉴别

Abstract:

Objective To explore the difference of CT manifestations between non-tuberculosis mycobacterium (NTM) lung disease patients with diabetes mellitus (DM) and those without DM,in order to improve the differential diagnosis of these two diseases. Methods A retrospective analysis of CT findings of 59 patients with NTM lung disease with DM (group A) and 59 patients with NTM lung disease without DM (group B) who were confirmed by clinical and laboratory tests in Guangzhou Chest Hospital from January to December 2018. The distribution of lesions and CT findings were compared between these two groups.SPSS 21.0 software was used for statistical analysis. χ2 test or continuous correction χ2 test were used for categorical data, statistical significance was set at P<0.05. Results (1) Lesion distribution: The incidence of lesions located in ≥3 lobes in group A (83.05%, 49/59) was higher than that in group B (66.10%, 39/59), the difference was statistically significant (χ2=4.470, P=0.035). (2) CT manifestations:The incidence of nodule and tree bud sign in group B were 88.14% (52/59) and 71.19% (42/59) respectively,higher than those in group A (67.80% (40/59), 52.54% (31/59)),differences were statistically significant (χ2=7.104, 4.346; P=0.008, 0.037).The incidence of solid shadow, cavity shadow, globular/lumpy shadow and honeycombing shadow in group A were 35.59% (21/59), 67.80% (40/59), 38.98% (23/59) and 25.42% (15/59) respectively, which were higher than those in group B (13.56%(8/59),49.15%(29/59),11.86%(7/59),3.39%(2/59)),differences were statistically significant (χ2=7.726,4.223,8.139,11.614;P=0.005,0.040,0.004,0.001).(3) Cavity lesions: The incidence of thick walled cavity in group A (55.93%, 33/59) was higher than that in group B (20.34%, 12/59), the incidence of thin walled cavity in group B (38.98%, 23/59) was higher than that in group A (22.03%, 13/59),these differences were both statistically significant (χ2=15.841, 3.997; P=0.000, 0.046). Cavities located in ≥3 lobes or the number of cavities ≥3 in group A accounted for 59.32% (35/59) and 57.63% (34/59) respectively, which were significantly higher than those in group B (28.81% (17/59) and 35.59% (21/59)), differences were statistically significant (χ2=11.140, 5.755; P=0.001,0.016). Conclusion Chest CT scan for patients with NTM lung disease with DM is more likely to show lesions with wide distribution, solid shadows, thick walled cavities, globular/lumpy shadows and honeycombing shadows;thin walled cavity, nodule and tree bud sign are more likely to be seen in patients without DM.Those CT manifestations are helpful for differential diagnosis.

Key words: Lung diseases, Mycobacterium infections,atypical, Diabetes mellitus, Comorbidity, Diagnostic imaging, Comparative study, Diagnosis,differential