Email Alert | RSS    帮助

中国防痨杂志 ›› 2018, Vol. 40 ›› Issue (7): 707-712.doi: 10.3969/j.issn.1000-6621.2018.07.008

• 论著 • 上一篇    下一篇

不同耐药类型及药物敏感肺结核患者的CT征象分析

李成海,周新华,吕岩(),于霞,李芳,贺伟,陈步东,王东坡,周震,宁锋钢   

  1. 101149 首都医科大学附属北京胸科医院放射科
  • 收稿日期:2018-04-16 出版日期:2018-07-10 发布日期:2018-09-07
  • 通信作者: 吕岩 E-mail:yanlvlv@126.com

Contrast analysis of CT findings of different types of drug-resistant tuberculosis and drug-sensitive tuberculosis

Cheng-hai LI,Xin-hua ZHOU,Yan LYU(),Xia YU,Fang LI,Wei HE,Bu-dong CHEN,Dong-po WANG,Zhen ZHOU,Feng-gang. NING   

  1. Department of Radiology, Beijing Chest Hospital, Capital Medical University, Beijing 101149, China
  • Received:2018-04-16 Online:2018-07-10 Published:2018-09-07
  • Contact: Yan LYU E-mail:yanlvlv@126.com

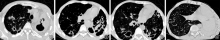
摘要:

目的 对照分析不同肺结核耐药类型及药物敏感肺结核患者的CT征象,以提高耐药肺结核的CT诊断及鉴别诊断水平。方法 搜集2016年1月1日至2017年10月31日首都医科大学附属北京胸科医院收治并明确诊断的116例耐药肺结核患者,对其临床及CT扫描资料进行回顾性分析。包括初治患者26例,复治患者90例;同时,采用分层抽样的方法,按照1∶4的比例,以随机数字表法抽取同期由本院收治并确诊的药物敏感肺结核(DS-PTB)患者31例。147例耐药患者根据药物敏感性试验(简称“药敏试验”)结果分成4个组,分别为耐多药肺结核组(MDR-PTB组)39例,广泛耐药肺结核组(XDR-PTB组)31例,其他耐药肺结核组(DR-PTB组)[包括单耐药肺结核(MR-PTB)41例+多耐药肺结核(PDR-PTB)5例]46例, DS-PTB组31例。全部患者均行胸部CT平扫并行层厚1.25mm薄层重建,对不同组别患者肺内病变的分布、CT征象和空洞结节发生率的差异进行统计学分析。结果 本组147例患者,CT表现对比分析显示,耐药肺结核患者病变分布范围广泛,累及3个肺叶及以上者[MDR-PTB组为84.6%(33/39)、XDR-PTB组为83.9%(26/31)、DR-PTB组为91.3%(42/46)]明显多于DS-PTB组(51.6%,16/31),差异均有统计学意义(χ 2=8.96,P=0.003;χ 2=7.38,P=0.007;χ 2=15.70,P<0.001);并且更容易累及肺结核的非常见部位(上叶前段及下叶基底段)[MDR-PTB组占94.9%(37/39)、XDR-PTB组占87.1%(27/31)、DR-PTB组占95.7%(44/46),与DS-PTB组(51.6%,16/31)比较,差异均有统计学意义(χ 2=17.58,P<0.001;χ 2=9.18,P=0.002;χ 2=20.88,P<0.001)];但三组耐药类型之间(MDR-PTB组与XDR-PTB组、MDR-PTB组与DR-PTB组、XDR-PTB组与DR-PTB组)病变肺叶分布数量及部位上差异均无统计学意义(χ 2值分别为0.00、0.38、0.40和0.53、0.00、0.88,P值分别为1.000、0.538、0.526和0.248、1.000、0.347)。CT征象对比分析显示,肺内出现结节、支气管管壁增厚在不同类型耐药肺结核患者中的发生率[MDR-PTB组分别为100.0%(39/39)和87.2%(34/39),XDR-PTB组分别为100.0%(31/31)和87.1%(27/31),DR-PTB组分别为100.0%(46/46)和84.8%(39/46)]均明显高于DS-PTB组[80.6%(25/31)和48.4%(15/31)],差异均有统计学意义(χ 2=5.97,P=0.015;χ 2=4.61,P=0.032;χ 2=7.15,P=0.007和χ 2=12.38,P<0.001;χ 2=10.63,P=0.001;χ 2=11.71,P=0.001);但不同耐药类型肺结核组之间(MDR-PTB组与XDR-PTB组、XDR-PTB组与DR-PTB组、MDR-PTB组与DR-PTB组)在支气管管壁增厚方面比较,差异均无统计学意义(χ 2值分别为0.00、0.00、0.10,P值分别为1.000、1.000、0.752)。结节及实变内出现空洞的比较, XDR-PTB组、DR-PTB组发生空洞的比率分别为87.1%(27/31)、87.0%(40/46),明显高于DS-PTB组的58.1%(18/31),差异均有统计学意义(χ 2=6.57,P=0.010,χ 2=8.32,P=0.004);但不同耐药类型肺结核组(MDR-PTB组与XDR-PTB组、XDR-PTB组与DR-PTB组、MDR-PTB组与DR-PTB组)之间比较,差异均无统计学意义(χ 2值分别为1.18、0.00、1.46,P值分别为0.277、1.000、0.227)。 结论 CT征象对耐药肺结核与药物敏感肺结核具有诊断及鉴别诊断价值,但对鉴别耐药类型无明显帮助。

关键词: 结核, 肺, 结核, 抗多种药物性, 诊断, 鉴别, 体层摄影术, X线计算机, 数据说明, 统计

Abstract:

Objective To compare the CT signs of different types of drug-resistant pulmonary tuberculosis (PTB) and drug-sensitive PTB (DS-PTB), and to improve the CT diagnosis and differential diagnosis of drug-resis-tant PTB.Methods The clinical and CT scan data of 116 drug-resistant PTB patients admitted to Beijing Chest Hospital from January 1, 2016 to October 31, 2017 were collected for retrospective analysis. There were 26 untreated patients and 90 retreated patients. Also, by the stratified sampling method at a ratio of 1∶4, 31 patients with DS-PTB admitted to this hospital at the same period were selected using random number table method. The 147 cases with drug-resistant TB were divided into 4 groups according to the results of drug sensitivity test (DST), that were multidrug-resistant PTB (MDR-PTB) group (39 cases), extensively drug-resistant PTB (XDR-PTB) group (31 cases), other drug-resistant PTB (DR-PTB) group (46 cases including 41 with mono-resistant PTB (MR-PTB) and 5 with poly-resistant tuberculosis (PDR-PTB)), and DS-PTB group (31 cases). All patients underwent chest CT non-contrast enhanced scan and thin layer reconstruction with a layer thickness of 1.25 mm. The distribution of lung lesions, CT signs and incidence of cavity in patients of different groups were statistically analyzed.Results Contrast analysis of CT findings of the 147 patients showed that the lesions in drug-resistant PTB patients was extensively distributed. The rates of patients with lesions involving three or more lobes were 84.6% (33/39) in the MDR-PTB group, 83.9% (26/31) in the XDR-PTB group, and 91.3% (42/46) in the DR-PTB group, which were higher than that in the DS-PTB group (51.6%, 16/31); the differences were statistically significant (χ 2=8.96, P=0.003; χ 2=7.38, P=0.007; χ 2=15.70, P<0.001). In addition, the lesions were more likely to involve the uncommon sites of TB infection (such as anterior superior lobe and lower lobe basal segment) (94.9% (37/39) in the MDR-PTB group, 87.1% (27/31) in the XDR-PTB group, 95.7% (44/46) in the DR-PTB group, and 51.6% (16/31) in the DS-PTB group; compared with the DS-PTB group, the rates in the MDR-PTB, XDR-PTB, and DR-PTB were statistically higher (χ 2=17.58, P<0.001; χ 2=9.18, P=0.002; χ 2=20.88, P<0.001). However, there was no significant difference in the number and location of lesions among the three drug-resistant PTB groups (MDR-PTB vs XDR-PTB group, MDR-PTB vs DR-PTB group, XDR-PTB vs DR-PTB group: χ 2 values were 0.00, 0.38, 0.40 and 0.53, 0.00, 0.88, respectively; P values were 1.000, 0.538, 0.526 and 0.248, 1.000, 0.347, respectively). Contrast analysis of CT signs showed that the incidences of nodules in the lungs and bronchial wall thickening in patients with different types of drug-resistant PTB were 100.0% (39/39) and 87.2% (34/39) in the MDR-PTB group, 100.0% (31/31) and 87.1% (27/31) in the XDR-PTB group, and 100.0% (46/46) and 84.8% (39/46) in the DR-PTB group, respectively, which were significantly higher than that in the DS-PTB group (80.6% (25/31) and 48.4% (15/31)); the differences were statistically significant (χ 2=5.97, P=0.015; χ 2=4.61, P=0.032; χ 2=7.15, P=0.007 and χ 2=12.38, P<0.001; χ 2=10.63, P=0.001; χ 2=11.71, P=0.001). However, there was no significant difference in the incidence of bronchial wall thickness among different drug-resistant PTB groups (MDR-PTB vs XDR-PTB group, XDR-PTB vs DR-PTB group, MDR-PTB vs DR-PTB group: χ 2 values were 0.00, 0.00, and 0.10; P values were 1.000, 1.000, and 0.752, respectively). As for the comparison on cavity formation in nodules and consolidations, the incidences in the XDR-PTB and DR-PTB groups were 87.1% (27/31) and 87.0% (40/46), significantly higher than that in the DS-PTB group (58.1%, 18/31); the differences were statistically significant (χ 2=6.57, P=0.010, χ 2=8.32, P=0.004). However, there was no significant difference among different drug-resistant PTB groups (MDR-PTB vs XDR-PTB group, XDR-PTB vs DR-PTB group, MDR-PTB vs DR-PTB group:χ 2 values were 1.18, 0.00, and 1.46; P values were 0.277, 1.000, and 0.227, respectively. Conclusion CT signs have diagnostic and differential diagnostic value for drug-resistant and drug-sensitive PTB, but it has no obvious value in identifying different drug-resistant types.

Key words: Tuberculosis, pulmonary, Tuberculosis, multidrug-resistant, Diagnosis, differential, Tomography, X-ray computed, Data interpretation, statistical