Email Alert | RSS    帮助

中国防痨杂志 ›› 2020, Vol. 42 ›› Issue (3): 240-244.doi: 10.3969/j.issn.1000-6621.2020.03.011

• 论著 • 上一篇    下一篇

能谱CT成像在肺结核与矽肺结节鉴别诊断中的价值

朱怡,刘荣荣,刘静,李敏()   

  1. 215000 苏州大学附属传染病医院 苏州市第五人民医院放射科
  • 收稿日期:2019-10-17 出版日期:2020-03-10 发布日期:2020-03-18
  • 通信作者: 李敏 E-mail:105549156@qq.com
  • 基金资助:
    2017年“科教兴卫”青年科技项目(KJXW2017047);2016年苏州市科技计划项目(SYS201656)

The value of energy spectrum CT imaging in the differential diagnosis of pulmonary tuberculosis nodules and silicosis nodules

ZHU Yi,LIU Rong-rong,LIU Jing,LI Min()   

  1. Department of Radiology, the Affiliated Infectious Diseases Hospital of Soochow University, The Fifth People’s Hospital of Suzhou, Suzhou 215000, China
  • Received:2019-10-17 Online:2020-03-10 Published:2020-03-18
  • Contact: Min LI E-mail:105549156@qq.com

摘要:

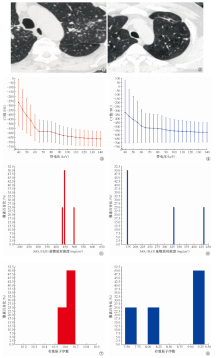
目的 探讨能谱CT成像在肺结核与矽肺结节鉴别诊断中的应用价值。方法 收集苏州市第五人民医院于2018年2—12月确诊并进行能谱CT扫描的肺结核患者35例(127个结节;肺结核组)和矽肺患者30例(180个结节;矽肺组)。通过能谱分析获得患者SiO2(H2O)基物质对浓度、有效原子序数值与40~70keV区间内的曲线斜率。结果 肺结核组和矽肺组SiO2(H2O)基物质对浓度的中位数(四分位数)分别为170(101,241)mg/cm 3和353(260,454)mg/cm 3,两组比较差异有统计学意义(Z=-24.95,P=0.000);肺结核组和矽肺组平均有效原子序数值分别为9.29±0.83和10.68±0.98,两组比较差异有统计学意义(t=29.96,P=0.000);肺结核组和矽肺组平均能谱曲线斜率分别为5.95±2.19和10.80±2.48,两组比较差异有统计学意义(t=-17.69,P=0.000)。当SiO2(H2O)基物质对浓度阈值为275mg/cm 3时,ROC曲线下面积最大(0.95),敏感度与特异度分别为87.40%、90.56%。结论 能谱分析工具中的SiO2(H2O)基物质对浓度、有效原子序数值与能谱曲线斜率均有助于对肺结核与矽肺的结节进行鉴别诊断,尤其SiO2(H2O)基物质对浓度的诊断价值更高。

关键词: 结核, 肺, 矽肺, 多发性肺结节, 体层摄影术, X线计算机, 诊断, 鉴别, 能谱CT

Abstract:

Objective To explore the value of energy spectrum CT imaging in differential diagnosis of pulmonary tuberculosis nodules and silicosis nodules. Methods Thirty-five cases of pulmonary tuberculosis (127 nodules; PTB group) and 30 cases of silicosis (180 nodules; silicosis group) diagnosed by energy spectrum CT scan from February to December 2018 in the Fifth People’s Hospital of Suzhou were enrolled in this study. The concentration of SiO2 (H2O) based substances, effective atomic number (EAN) and slope of curve in 40-70 keV range were obtained by energy spectrum analysis. Results The median (quartile) concentration of SiO2 (H2O) based substances in PTB group and in silicosis group were 170 (101,241) mg/cm 3 and 353 (260,454) mg/cm 3 respectively, with statistically significant difference (Z=-24.95, P=0.000); the mean EAN in PTB group and silicosis group were 9.29±0.83 and 10.68±0.98 respectively, with statistically significant difference (t=29.96, P=0.000); the average slope of the energy spectrum curve in PTB group and silicosis group were 5.95±2.19 and 10.80±2.48, the difference between those two groups was statistically significant (t=-17.96, P=0.000). When the threshold of the concentration of SiO2 (H2O) based substances was 275 mg/cm 3, the area under the ROC curve was the largest (0.95), and the sensitivity and specificity were 87.40% and 90.56% respectively. Conclusion The concentration of SiO2(H2O)based substances, EAN and slope of energy spectrum curve in energy spectrum CT are helpful for differential diagnosis of PTB nodules and silicosis nodules, among them the concentration of SiO2 (H2O) based substances is of higher value especially.

Key words: Tuberculosis, pulmonary, Silicosis, Multiple pulmonary nodules, Tomography, X-ray compute, Diagnosis, differential, Energy spectrum CT