Email Alert | RSS    帮助

中国防痨杂志 ›› 2019, Vol. 41 ›› Issue (9): 1009-1014.doi: 10.3969/j.issn.1000-6621.2019.09.018

• 论著 • 上一篇    下一篇

鸟-胞内分枝杆菌肺病伴空洞的CT特征分析

周荣真,吴秀丽,王健,杨海,季文斌()   

  1. 317000 临海,温州医科大学附属台州医院放射科
  • 收稿日期:2019-05-27 出版日期:2019-09-10 发布日期:2019-09-06
  • 通信作者: 季文斌 E-mail:jiwb@enzemed.com

CT features analysis of Mycobacterium avium-intracellulare complex lung disease with cavities

Rong-zhen ZHOU,Xiu-li WU,Jian WANG,Hai YANG,Wen-bin JI()   

  1. Department of Radiology,Taizhou Hospital,Wenzhou Medical University, Zhejiang Province, Linhai 317000,China
  • Received:2019-05-27 Online:2019-09-10 Published:2019-09-06
  • Contact: Wen-bin JI E-mail:jiwb@enzemed.com

摘要:

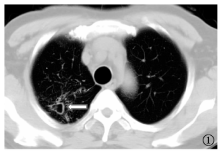
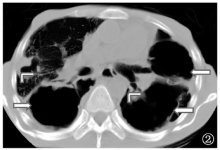
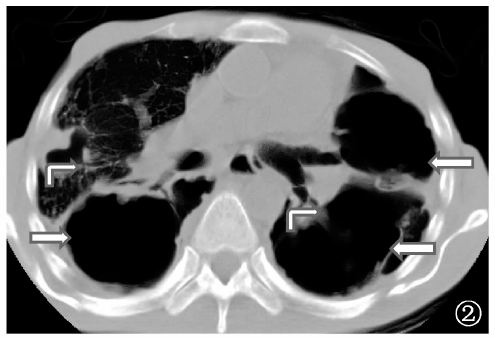
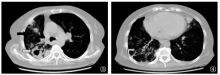
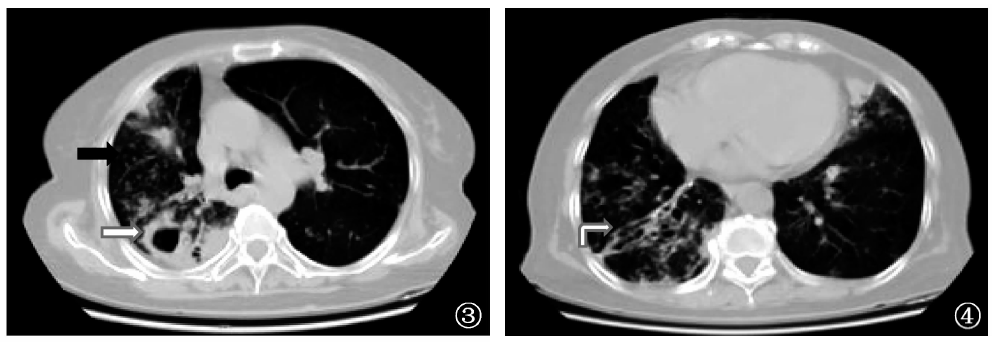
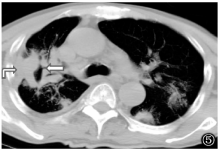
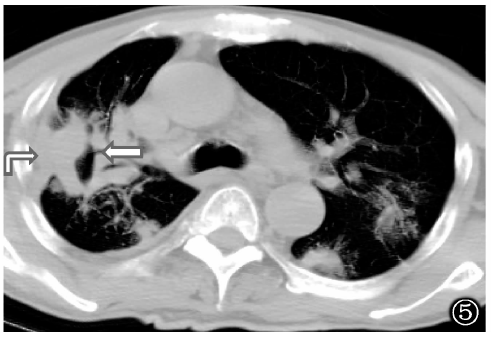
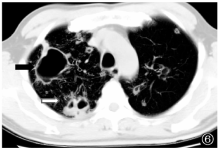
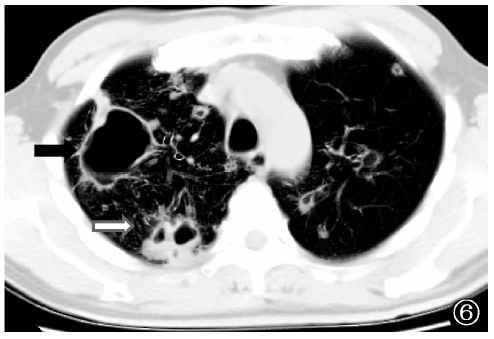
目的 探讨鸟-胞内分枝杆菌(MAC)肺病伴空洞的CT特征,以期为临床诊断提供帮助。方法 回顾性收集温州医科大学附属台州医院2014年6月至2018年12月期间菌种鉴定为MAC肺病且胸部CT扫描显示伴有空洞的21例患者入组(观察组);采用1∶1病例对照研究,选取同时期符合纳入标准的21例空洞型肺结核患者作为对照组,匹配原则为同性别、年龄±2岁。分析两组空洞类型、壁厚、直径,以及支气管扩张征、实变影、长径>1cm的结节或肿块、小叶中心性结节(包括树芽征)、胸腔积液、纵隔淋巴结钙化的差异。结果 观察组共检出空洞74个,空洞直径的中位数(四分位数)[M(Q1,Q3)]为27.9(17.3,39.8)mm,空洞壁厚的M(Q1,Q3)为2.7(1.7,4.1)mm;对照组共检出空洞55个,空洞直径的M(Q1,Q3)为20.6(13.4,32.0)mm,空洞壁厚的M(Q1,Q3)为3.6(2.5,4.7)mm;两组比较差异均有统计学意义(Z值分别为-2.241、-2.431,P值均<0.05);观察组薄壁空洞检出构成比以及支气管扩张、支气管扩张伴小叶中心性结节检出率分别为60.8%(45/74)、85.7%(18/21)、57.1%(12/21),均明显高于对照组[分别占36.4%(20/55)、38.1%(8/21)、23.8%(5/21)],差异均有统计学意义(χ 2值分别为7.543、10.096、4.842,P值均<0.05);观察组厚壁空洞、周围卫星灶、引流支气管征检出构成比以及长径>1cm肺结节检出率分别为39.2%(29/74)、58.1%(43/74)、28.4%(21/74)、23.8%(5/21),均明显低于对照组[分别占63.6%(35/55)、94.5%(52/55)、63.6%(35/55)、76.2%(16/21)],差异均有统计学意义(χ 2值分别为7.543、21.582、15.966、11.524,P值均<0.05)。 结论 MAC肺病患者胸部CT扫描更易看到薄壁空洞伴支气管扩张、肺小结节;肺结核患者CT扫描更易看到厚壁空洞伴引流支气管征、周围卫星灶、长径>1cm肺结节,两者CT表现有各自的特点,可为临床早期诊断与治疗提供一定的帮助。

关键词: 肺疾病, 分枝杆菌感染,鸟,细胞内, 结核,肺, 疾病特征, 对比研究

Abstract:

Objective This study aimed to explore the CT features of Mycobacterium avium-intracellulare complex (MAC) lung disease with cavities, which might be able to assist in clinical diagnosis.Methods A total of 21 patients who diagnosed as MAC lung disease and presented chest CT scan with cavities (served as the observation group) were retrospectively collected from the Taizhou Hospital affiliated to Wenzhou Medical University between June 2014 to December 2018. Meanwhile, based on 1∶1 case-control study, 21 patients with cavitary tuberculosis who met the inclusion criteria as well as matched by gender and age ±2 year were selected as the control group. Then several indicators, including types of cavities, wall thickness, diameter, bronchiectasis, consolidation, nodules or masses with a long diameter >1 cm, central nodules of the lobes (including tree buds), pleural effusion, mediastinal lymph node calcification, were compared between the two groups.Results A total of 74 cavities were detected in the observation group, among which, the median (quartile) diameter of the cavity (M(Q1,Q3)) was 27.9 (17.3, 39.8) mm, and the median wall thickness of the cavity was 2.7 (1.7, 4.1) mm; meanwhile, 55 cavities were detected in the control group with 20.6 (13.4, 32.0) mm of the median diameter of the cavity and 3.6 (2.5, 4.7) mm of the median wall thickness of the cavity. There were significantly statistical differences in terms of diameter and wall thickness between the two groups (Z values: -2.241, and -2.431, respectively, and all P values <0.05). The detection ratio of thin-walled cavities as well as the detection rates of bronchiectasis, and bronchiectasis accompanied with central nodules of the lobes in the observation group were 60.8% (45/74), 85.7% (18/21), and 57.1% (12/21), respectively, which were higher than those in the control group (36.4% (20/55), 38.1% (8/21), and 23.8% (5/21), respectively), with the statistically significant differences ( χ 2 values: 7.543, 10.096, and 4.842, respectively; all P values <0.05); the detection ratios of thick-walled cavities, surrounding satellite foci, and drainage bronchus, as well as the detection rate of lung nodules with long diameter >1 cm in the observation group were 39.2% (29/74), 58.1% (43/74), 28.4% (21/74), and 23.8% (5/21), respectively, which were lower than those in the control group(63.6% (35/55), 94.5% (52/55), 63.6% (35/55), and 76.2% (16/21), respectively), with the statistically significant differences (χ 2 values: 7.543, 21.582, 15.966, and 11.524, respectively; all P values <0.05). Conclusion Patients with MAC lung disease more likely present CT scans with thin-walled cavities accompanied with bronchiectasis and small pulmonary nodules; while CT scans of tuberculosis patients more likely show thick-walled cavities accompanied with drainage bronchus, surrounding satellite foci, and pulmonary nodules with a long diameter >1 cm. The CT findings of different patients display their own characteristics, which can contribute to the early clinical diagnosis and treatment.

Key words: Lung diseases, Mycobacterium avium-intracellulare infection, Tuberculosis,pulmonary, Disease attributes, Comparative study