Email Alert | RSS    帮助

中国防痨杂志 ›› 2019, Vol. 41 ›› Issue (8): 893-899.doi: 10.3969/j.issn.1000-6621.2019.08.017

• 论著 • 上一篇    下一篇

2008—2018年新疆维吾尔自治区肺结核空间流行病学特征分析

赵珍,刘年强,依帕尔·艾海提,王希江()   

  1. 830002 乌鲁木齐,新疆维吾尔自治区疾病预防控制中心结核病与麻风病预防控制中心
  • 收稿日期:2019-04-25 出版日期:2019-08-10 发布日期:2019-08-13
  • 通信作者: 王希江 E-mail:2500681817@qq.com

Epidemiological and spatial distribution characteristics of tuberculosis in Xinjiang Uygur Autonomous Region from 2008 to 2018

Zhen ZHAO,Nian-qiang LIU,Aihaiti YIPAER•,Xi-jiang WANG()   

  1. Tuberculosis/Leprosy Prevention and Control Center, Center for Disease Control and Prevention of Xinjing Uygur Autonomous Region,Urumqi 830002,China
  • Received:2019-04-25 Online:2019-08-10 Published:2019-08-13
  • Contact: Xi-jiang WANG E-mail:2500681817@qq.com

摘要:

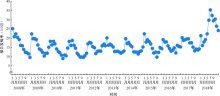
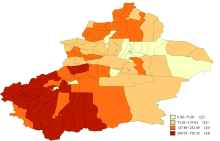
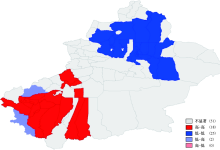
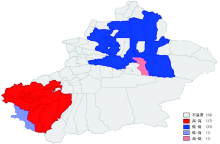
目的 分析新疆维吾尔自治区(简称“新疆”)肺结核流行病学特征及空间聚集性变化。方法 通过《中国疾病预防控制信息系统》获得新疆2008年1月至2018年12月肺结核报告发病资料,描述三间分布特征,绘制流行曲线、发病率地图。采用空间自相关方法,计算Moran指数(Moran I)值,绘制空间关联局域指标(LISA)聚集性地图。结果 新疆2008—2018年累计报告肺结核479946例,男∶女=1.16∶l (257337/222609);年龄构成以>55岁为主,占56.82%(272701/479946);职业分布以农民为主,占70.61%(338890/479946)。2008—2018年肺结核报告发病率总体呈上升趋势,从2008年的202.93/10万上升到2018年304.94/10万,差异有统计学意义( χ 趋势 2 =19507.491,P<0.001)。除2018年报告发病率高峰在7月份(35.29/10万,8628/24446713),2008—2017年报告发病率的月份分布高峰均在1~3月,波动范围在17.64/10万~25.06/10万(3897/22087038~5339/21307980)。南疆4个地州(喀什地区、克孜勒苏柯尔克孜自治州、阿克苏地区与和田地区)各县(市、区)报告发病率较高,尤其是喀什地区英吉沙县最高(720.56/10万)。2008—2018年报告发病率均呈现空间聚集性分布,差异有统计学意义(Moran I=0.696,Z=11.462,P<0.001)。共有17个高-高聚类区,均在南疆四地州的大部分县市。结论 新疆肺结核防治工作应该以男性、农民为防控重点人群,以南疆作为结核防控的重点地区。

关键词: 结核,肺, 流行病学研究, 小地区分析, 数据说明,统计, 空间自相关

Abstract:

Objective To investigate changes of epidemiological characteristics and spatial aggregation of tuberculosis in Xinjiang.Methods Data of tuberculosis incidence reported in Xinjiang from January 2008 to December 2018 were obtained through China Disease Prevention and Control Information System. Then distribution features were described and the epidemic curve and incidence map were drawn. The spatial autocorrelation analysis was used to calculate the Moran’s I value and draw the aggregation map of spatial correlation local index (LISA).Results From 2008 to 2018, a total of 479946 cases of tuberculosis were reported in Xinjiang. The male to female ratio was 1.16 (257337/222609).Age composition was mainly over 55 years old, accounting for 56.82% (272701/479946) of all cases. Occupation distribution was dominated by farmers, accounting for 70.61%(338890/479946). The reported incidences of tuberculosis were rising from 202.93/100000 to 304.94/100000 between 2008 and 2018, the chi-square test showed statistically significant differences ( χ frequency 2 =19507.491,P<0.001). Except for the peak in July of 2018 (35.29/100000, 8628/24446713), the annual distribution peak of reported incidence in the months of 2008-2017 were always from January to March, ranging from 17.64/100000-25.06/100000 (3897/22087038-5339/21307980). The reported incidence rates in four prefectures of southern Xinjiang (kashgar, kezhou, aksu and hetian) were higher than other regions. In particular, the highest was in the county of Yingjisha in Kashgar prefecture (720.56/100000). Reported incidence rates presented spatial aggregation from 2008 to 2018, and the test showed statistically significant differences (Moran’s I=0.696,Z=11.462,P<0.001).There were a total of 17 high-high clustering areas, which were located in most counties in the four prefectures of southern Xinjiang. Conclusion Men and farmers are the key population for the prevention and control of tuberculosis, and southern Xinjiang is the key area for the prevention and control of tuberculosis in Xinjiang.

Key words: Tuberculosis,pulmonary, Epidemiological studies, Small-area analysis, Data interpretation, Statistical spatial autocorrelation